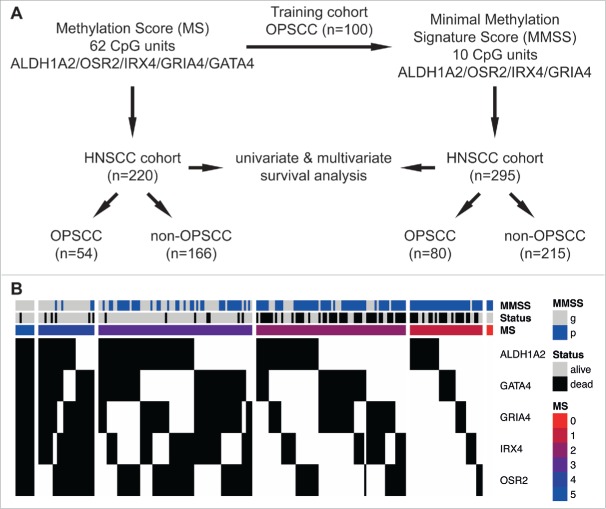
Figure 1.
Schematic representation of the study design and association between the MS, the MMSS and the survival status of HNSCC patients. (A) The MS was evaluated based on quantitative MassARRAY data of 62 CpG units in proximal promoters of ALDH1A2, OSR2, IRX4, GRIA4 and GATA4 as described previously 25, and revealed informative data for 220 patients of the HNSCC cohort (n = 54 OPSCC and n = 166 non-OPSCC). The MMSS was established as a less complex signature, consisting of the 10 most informative CpG units in proximal promoters of ALDH1A2, OSR2, IRX4 and GRIA4, with data of the training cohort (n = 100; 25), and was applied on patients of the HNSCC cohort (n = 295 with n = 80 OPSCC and n = 215 non-OPSCC). Univariate and multivariate survival analysis was conducted to confirm prognostic effects of MS and MMSS. (B) Heatmap summarizing the MS, the MMSS and the survival status of HNSCC patients. Each column indicates a patient of the HNSCC cohort (n = 220) and the methylation status according to the established pattern ALDH1A2low, OSR2low, GATA4high, GRIA4high, IRX4high for favorable prognosis is indicated in black (congruent) or white (non-congruent). The colored bars indicate the final value for MS and the MMSS is depicted in blue (MMSS_p) or gray (MMSS_g). The survival status is indicated in gray (alive) or black (dead).

