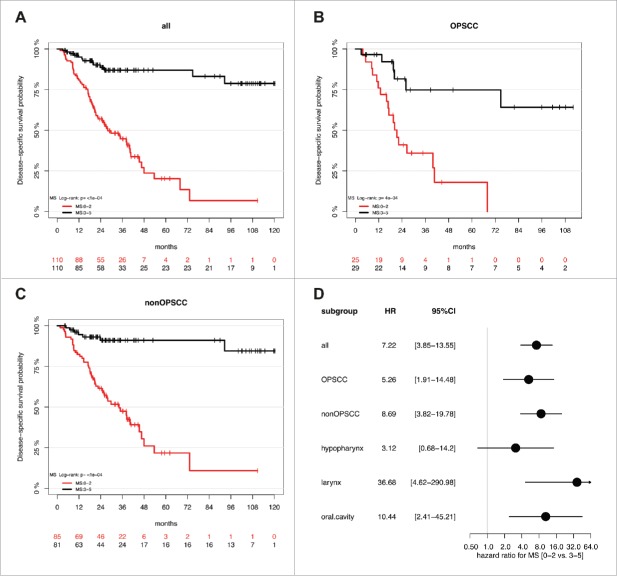
Figure 2.
A high MS serves as prognostic biomarker for favorable survival in a HNSCC cohort. Kaplan-Meier plots demonstrate an improved survival of the MS3-5 (black line) as compared to the MS0-2 subgroup (red line), which is highly significant for all HNSSC patient (n = 220, A), as well as for the subgroup of patients with either OPSCC (n = 54, B) or non-OPSCC (n = 166, C). (D) The Forest plot displays the relative strength of prognostic effects as HR and 95% CI according to the methylation subgroup (MS0-2 vs. MS3-5) on disease-specific survival for all HNSCC (n = 220), and subgroup of patients with OPSCC (n = 54), non-OPSCC (n = 166), hypopharyngeal (n = 30), laryngeal (n = 69) and oral SCC (n = 63).

