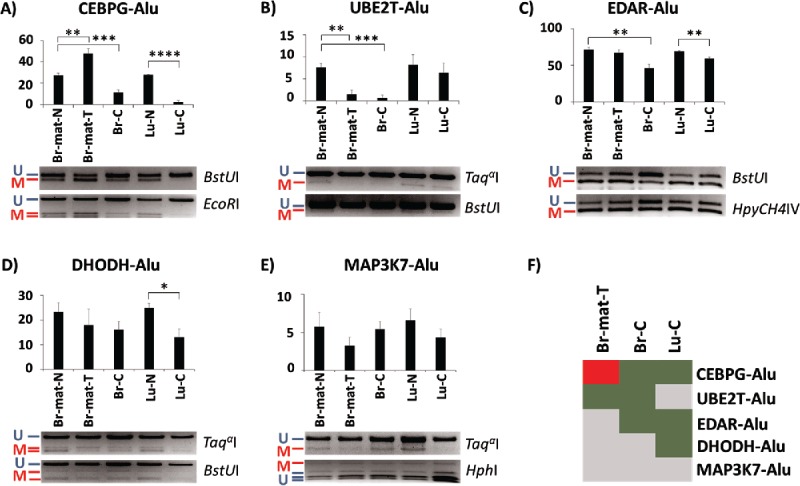
Figure 2.

Methylation variation of AluYa5 and Yb8 loci closely associated with a gene in normal and cancer samples. Alu elements are named after their associated gene. (A-E) Methylation levels are quantified through COBRA, followed by densitometry, in 5 tissues: matched breast normal (Br-mat-N); matched breast primary tumor (Br-mat-T); breast cancer (Br-C); normal lung (Lu-N); and lung cancer (Lu-C). Bands are labeled as either methylated (red “M”) or unmethylated (blue “U”), along with the appropriate restriction enzyme. * P < 0.05; ** P ≤ 0.01; *** P ≤ 0.001; **** P ≤ 0.0001. Error bars indicate standard error of mean (SEM). (F) Relative to the appropriate control, CEBPG-Alu, UBE2T-Alu, EDAR-Alu and DHODH-Alu showed significant difference in methylation in at least one test sample. Heatmap summarizes the results as hypermethylation (red), hypomethylation (green), and no significant change (gray).
