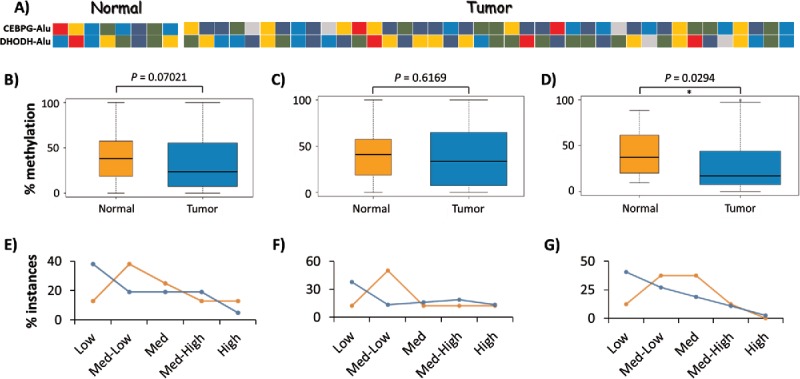
Figure 4.

Interindividual variation in DNA methylation of AluYa5 and Yb8. (A) Heatmap showing the average methylation level of CEBPG-Alu and DHODH-Alu in 8 normal and 40 breast tumor samples as determined by the COBRA assay: dark blue, 0–20% methylation (Low); blue, 20–40% (Medium-Low); green, 40–60% (Medium); gold, 60–80% (Medium-High); and red, 80–100% (High). (B-G) Variation in methylation levels for CEBPG-Alu in normal vs. tumor samples for CpG sites recognized by: both BstUI and HpyCH4III (B, E); BstUI only (C, F); and, HpyCH4III only (D, G). Panels B-D represent statistical analyses of data from all samples as pooled into normal vs. tumor, with significant hypomethylation only at the HpyCH4III site; Panels E-G depict the relative numbers of samples in each group as pooled into 5 levels of variation in methylation, with more tumor samples methylated at Low (0–20%) levels at all tested CpG sites.
