
Figure 5.
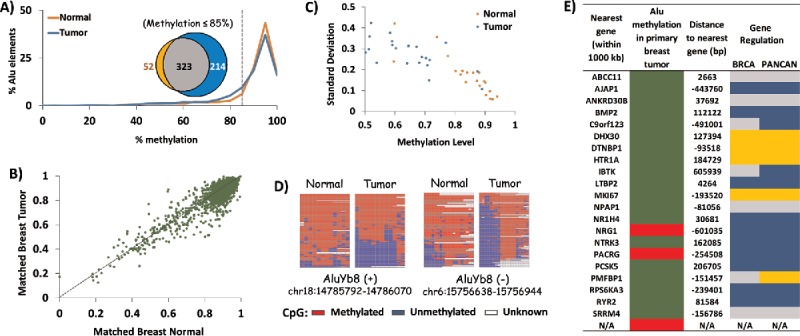
Tumorigenesis-related variation in DNA methylation of AluYb8. HT-TREBS analysis of matched breast normal and primary tumor tissues showing tumorigenesis-related variations in DNA methylation of AluYb8 elements. (A) Methylation profile of the normal (orange) and tumor (blue) samples, based on the percent Alu elements belonging to methylation bins in increments of 5%. The venn-diagram (inset) shows the 4X higher number of hypomethylated loci (<85% methylation; dotted line) in the tumor (blue) compared to the normal tissue (orange). (B) Methylation level of individual Alu loci in the matched breast tumor vs. normal, with each dot representing one Alu locus. Most loci follow the y = x dotted line, indicating no major difference in methylation between the 2 tissues. (C) Variation in methylation (standard deviation) vs. methylation level of the 22 differentially methylated AluYb8 loci, indicating lower methylation and higher levels of variation in the tumor tissue (blue) compared to the normal tissue (orange). (D) Heatmaps showing methylation levels of 2 AluYb8 loci in normal and tumor tissues. (E) Summary of information with respect to the nearest gene associated with the 22 differentially methylated AluYb8 loci (green for hypomethylation and red for hypermethylation). Negative sign (−) indicates that the gene is upstream of the Alu element; “N/A” indicates no gene within 1000 kb of the Alu element. Gene regulation information is from the invasive breast cancer (BRCA) and Pan-Cancer (PANCAN) data sets from TCGA; using Student t-test (P <0.05), genes were classified as downregulated (blue) or upregulated (gold). Gray indicates no significant change.