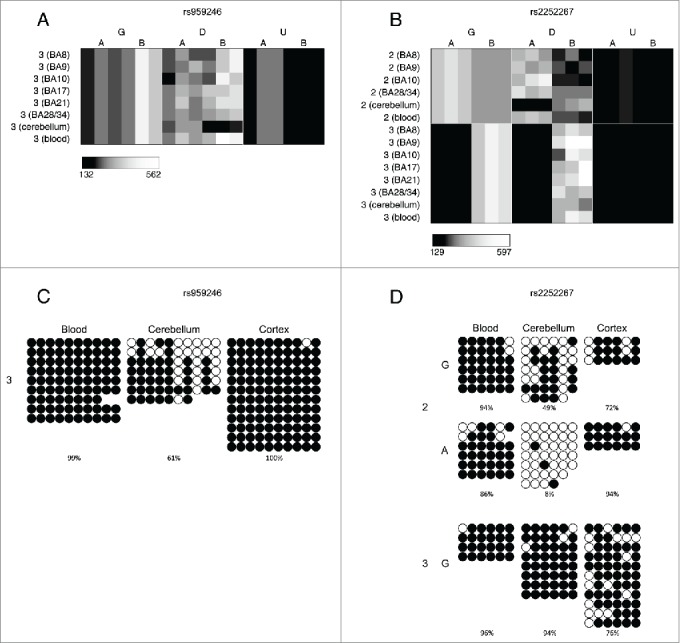
Figure 3.

A number of loci are characterized by allelic-skewing of DNA methylation in only one tissue with minimal ASM present in any of the other tissues examined. Heatmaps display allele signal intensities for genomic DNA (G), MSRE-digested DNA (D) and fully unmethylated, MSRE-digested DNA (U) in all tissues. A and B denote the 2 alleles of the SNP and brightness represents the quantile normalized signal intensity, with the scale displayed below the heatmap. Two of the top-ranked cerebellum-specific ASM signals are (A) rs959246 (informative for individual 3) and (B) rs2252267 (informative for individual 2). The tissue-specific patterns of DNA methylation in these 2 loci were validated by clonal bisulfite sequencing, confirming the findings from the MSNP assay (C,D). Each row represents a single DNA molecule, with black dots depicting methylated cytosines and white dots depicting unmethylated cytosines. The percentage of methylated cytosines for each sample is displayed below the plots. The amplicon spanning the DMR associated with rs959246 in (C) did not encompass a SNP enabling us to distinguish between the 2 alleles, however the methylation pattern shows evidence for tissue-specific intermediate methylation (IM) in the cerebellum. G and A in (D) denote the 2 alleles determined by SNP variation within the amplicon in heterozygous individual 2. Cerebellum-specific hypomethylation of the A allele is observed surrounding rs2252267, with individual 3 (homozygous for the G allele) being highly methylated in all 3 tissues.
