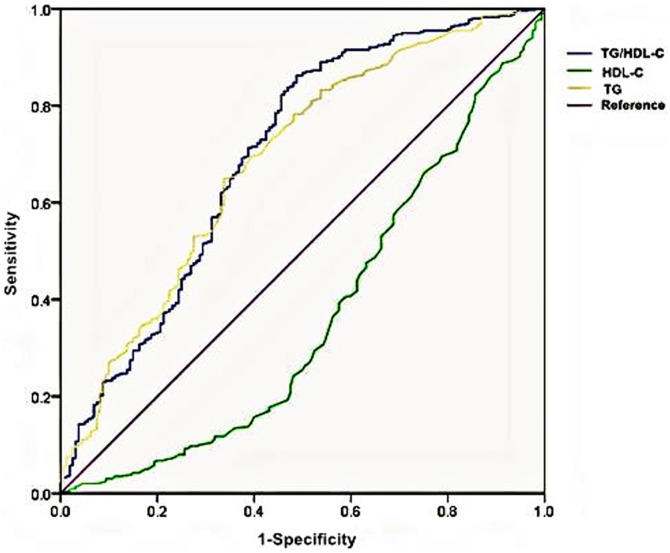
Fig 1. Receiver operating characteristic (ROC) curves of TG/HDL-C, TG, and HDL-C for insulin resistance.
The area under the ROC curve ± standard error (95% CI):TG/HDL-C: 0.70 ± 0.03(0.65–0.75); TG: 0.69 ± 0.03(0.64–0.74); HDL-C: 0.37 ± 0.03(0.31–0.42). Abbreviations: TG:triglyceride; HDL-C:high-density lipoprotein cholesterol; TG/HDL-C:triglyceride to high-density lipoprotein cholesterol ratio.

