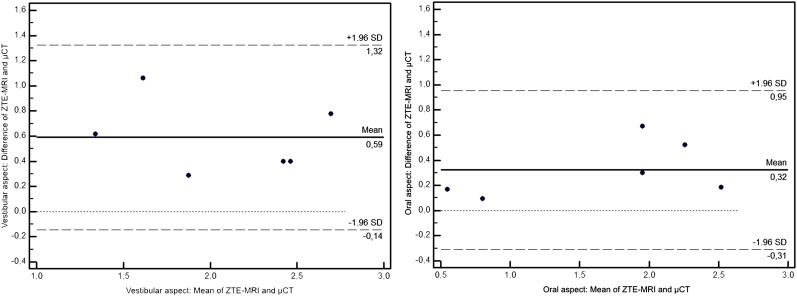
Figure 5.
Bland–Altman plots of the difference between the mean MRI and mean micro-CT (μCT) measurements on the vestibular and oral aspects. Each dot represents a measurement of one examiner at one time point (overall two examiners at each three time points). SD, standard deviation; ZTE-MRI, zero echo time MRI.

