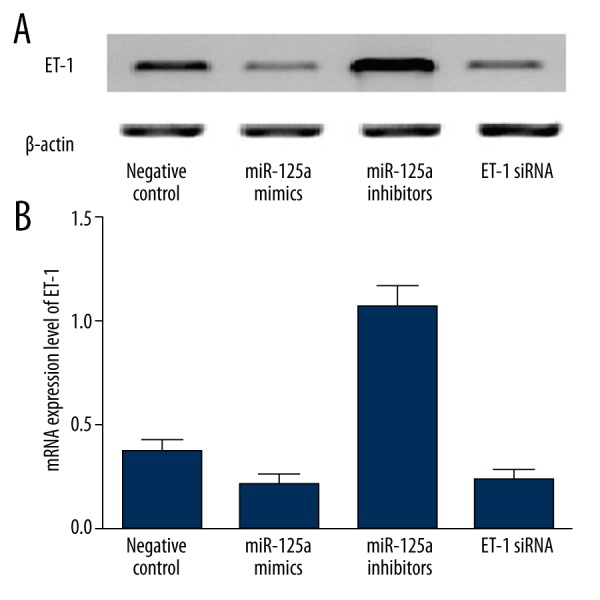
Figure 3.

(A) ET-1 protein expression level of cells transfected with miR-125a mimics, miR-125a inhibitors, and ET-1 siRNA as compared with the negative control group. (B) ET-1 mRNA expression level of cells transfected with miR-125a mimics, miR-125a inhibitors, and ET-1 siRNA compared with the negative control group.
