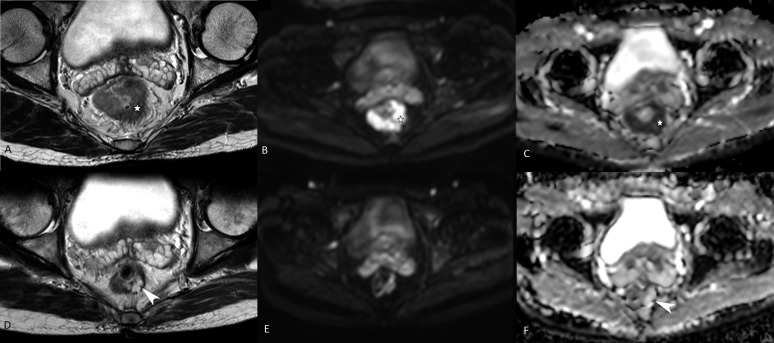
Figure 2.
Pre- and post-chemoradiotherapy T2 weighted (T2W) MRI and diffusion-weighted images in a tumour showing histopathological complete response. Upper panel (a, b and c), intermediate signal intensity tumour (asterisks) on T2W MR showing restricted diffusion on diffusion-weighted imaging and apparent diffusion coefficient. Lower panel (d, e and f), showing residual hyperintense lesion (arrowhead d) in the left posterolateral wall on T2W MRI. Facilitated diffusion is noted on diffusion-weighted imaging (arrowhead in f).

