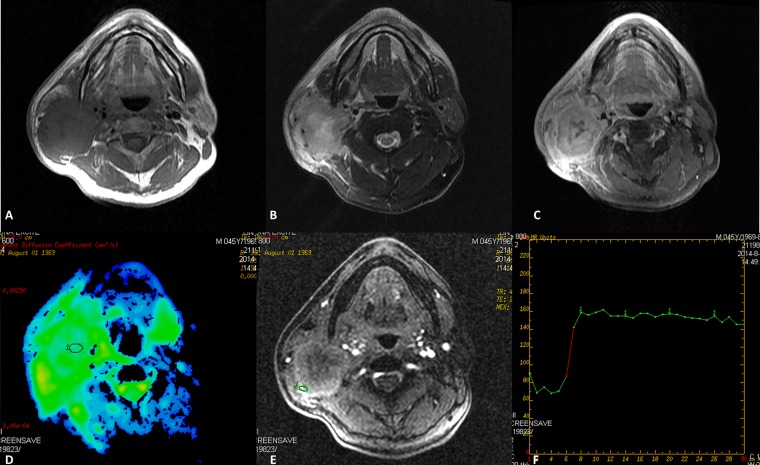
Figure 2.
Mucoepidermoid carcinomas of the right parotid gland in a 45-year-old male. (a) Axial T1 weighted imaging (b) T2 weighted imaging and (c) contrast-enhanced T1 weighted imaging show an ill-defined heterogeneously enhanced mass with infiltration into adjacent structure. The round cursors mark the regions of interest selected (d) for the measurement of the apparent diffusion coefficient (ADC) value in ADC map and (e) for signal intensity measurement at dynamic MRI. The ADC value is 0.980 × 10⁻³ mm2 s−1, which is lower than the cut-off value. (f) Time–signal intensity curve shows a plateau enhancement pattern (Type B). TE, echo time; TR, repetition time.

