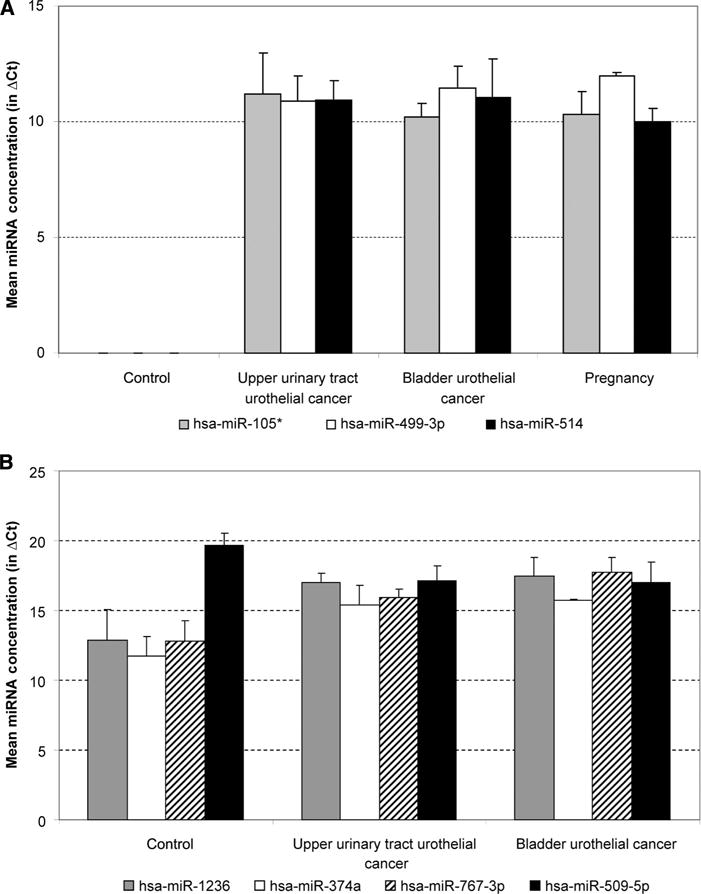
Fig. 2. miRNA distribution in various urine samples.

(A), Examples of miRNAs detectable only in urine samples other than the control samples. (B), miRNAs that show differences between the urothelial cancers. ΔCt, difference in cycle threshold values.
