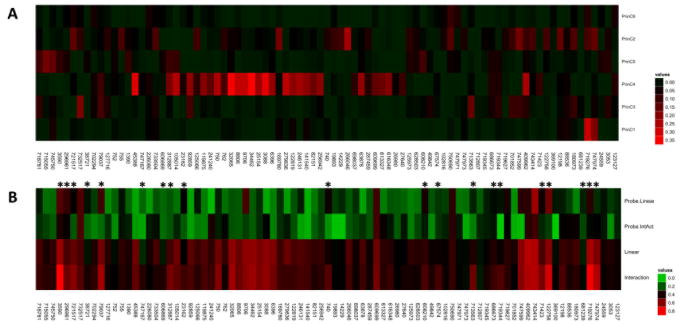
Figure 2. Background Networks and Drug Response Models.
A) The correlation of drug response values with the background gene expression networks is displayed as a heatmap or Adjusted R-squared values. The maximum observed correlation is 0.36 between background network 4 and uracil nitrogen mustard (NSC 34462). Other strong correlations are observed between background network 4 and other alkylating agents. Weaker correlations are observed between the other components and a single agent, whereas most agents are not strongly correlated with any background network. B) The highest adjusted R-square value attained for the directly linear (Linear) and interaction model (Interaction) is displayed. Additionally, the R-square value for the probe, in isolation, from each of the most predictive models is displayed for the directly linear (Probe.Linear) and interaction (Probe.IntAct) model is show. Drugs showing at least a 10% improvement in adjusted R-square value in the interaction models are marked with an asterisk. Comparison of rows 3 and 4 reveals an increase in predictive power when background networks are utilized. Comparison of rows 1 and 2 reveals that the probes from the interaction models showing an improvement over the directly linear models are less predictive in isolation than the most predictive probe from the directly linear models (more and brighter green cells). Note that the significance of each color differs in Figure 2A vs. Figure 2B, as depicted by the different color bars.

