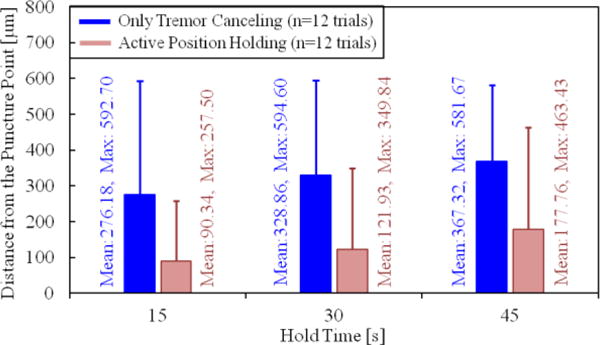
Figure 7.

Deviation from the puncture point vs. the hold time. The solid bars show the mean distance from the puncture point, and the error bars represent the maximum value. A longer hold time causes the needle to move away from the puncture point more. The active position holding significantly helps in keeping the needle tip proximal to the puncture point.
