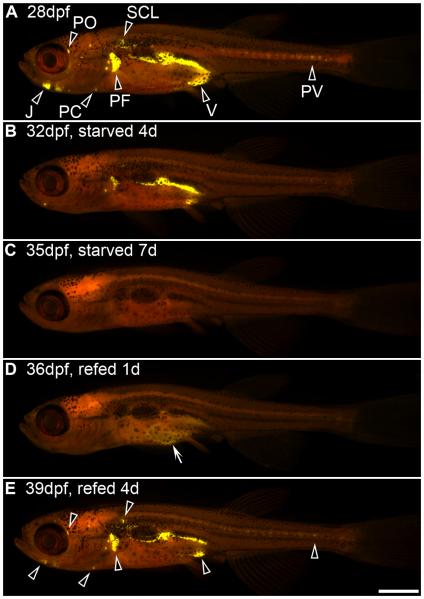
Fig. 2.
Longitudinal analysis of zebrafish adipose depots can be used to visualize fat mobilization in response to starvation, and fat deposition in response to refeeding. Zebrafish were starved for 7 days beginning at 28 dpf (9.6 ± 0.4 mm SL) and then refed for 4 days. Individual zebrafish were stained with Nile Red and imaged daily using a fluorescence stereomicroscope with a GFP longpass emission filter set to monitor neutral lipid deposits (black arrowheads in A and E). Panels A–E depict an individual representative animal. (A) Zebrafish fed normally through 28 dpf store neutral lipid in multiple salient adipose depots, including visceral (V), pectoral fin plate (PF), pericardial (PC), jaw (J), perivertebral (PV), periorbital (PO), and subcutaneous lateral (SCL) depots. Note that zebrafish begin depositing fat in additional adipose depots [e.g., subcutaneous dorsal (SCD), subcutaneous ventral (SCV), and at the base of fins] at subsequent developmental stages (Imrie and Sadler, in press; J. Minchin, unpublished). (B) When starved for 4 days, neutral lipid depots were reduced in all locations, although the larger visceral and pectoral fin plate depots were the last to be exhausted. (C) After 7 days of starvation, all neutral lipid depots were depleted. (D) Refeeding for 1 day was sufficient to form transient neutral lipid deposits in the intestine (white arrow in D), and refeeding for 4 days was sufficient to reestablish neutral lipid depots in the same locations as before starvation (black arrowheads in E and A). Anterior is to the left, and dorsal to the top in all images. Scale bar: 1 mm. This research was originally published in Flynn et al. (2009). © The American Society for Biochemistry and Molecular Biology.

