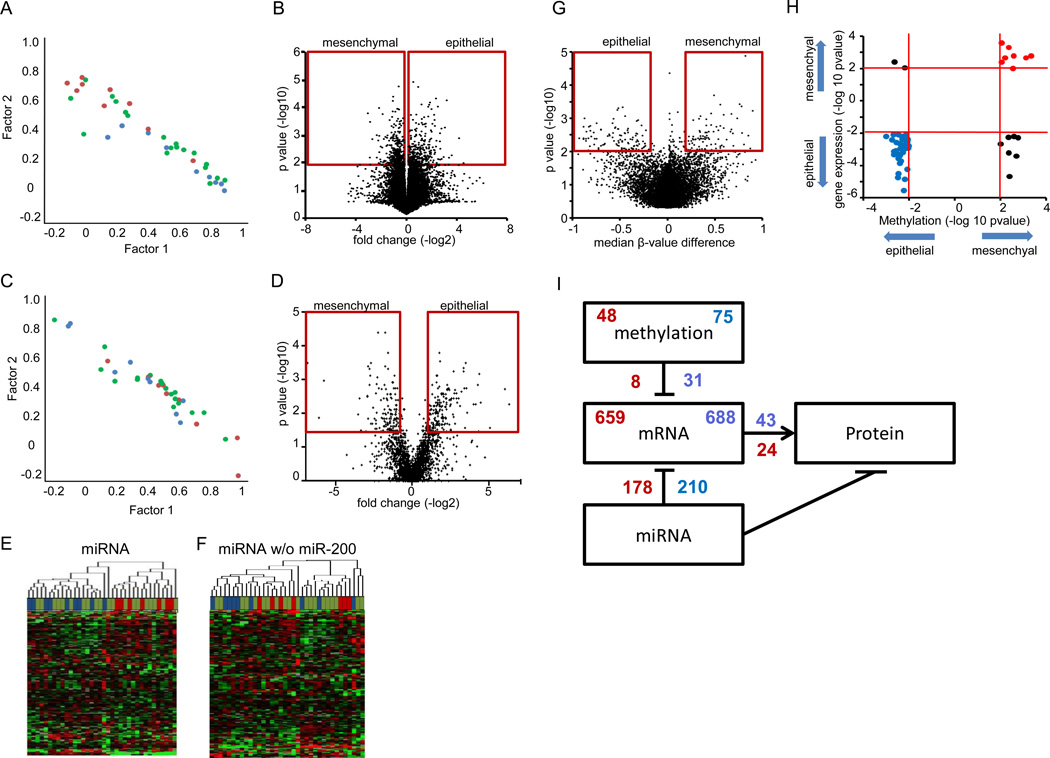
Figure 2. Molecular characterization of mesenchymal and epithelial cell lines.
A. Factor analysis of gene expression showing distribution of cell lines. B. Volcano plot of the differential gene expression analysis. Red box indicates significance cutoffs. C. Factor analysis of protein expression showing distribution of cell lines. D. Volcano plot of the differential protein expression analysis. Red box indicates significance cutoffs. E. Unsupervised hierarchical clustering of microRNA expression from 36 lung adenocarcinoma cell lines separates the epithelial and mesenchymal cell lines into separate clusters. F. Unsupervised hierarchical clustering of microRNA expression without miR-200 family members. G. Volcano plot of the differential DNA methylation analysis. Red box indicates significance cutoffs. H. Starburst plot integrating differential DNA methylation and gene expression analyses. I. Overlaping regulation of gene and protein expression. For sub figures A, C, E and F, mesenchymal cell lines are indicated by red, epithelial by blue, and hybrid cell lines by green.

