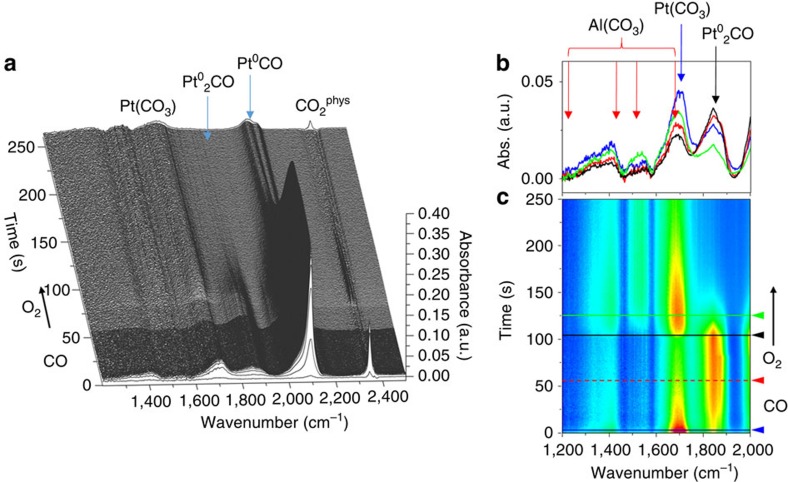
Figure 2. DRIFTS during periodic redox operation at 298 K.
(a) DRIFTS spectra derived from a first CO/O2 cycle shown in Fig. 1. (b) The 1,200–2,000 cm−1 region of the DRIFTS shown to emphasize the reactive behaviour of species below ca. 1,750 cm−1 as compared with the bridging  CO (ca. 1,850 cm−1). (b) Individual absorbance spectra corresponding to the different arrow/lines shown in c. The band positions expected for different aluminum carbonates (red), Pt(CO3) (blue) and
  CO (black) are also given21,22. (c) Colour map representation of the same set of DRIFTS spectra of a. The red arrow shows the changeover point in time between the CO/Ar flow and the O2/Ar flow; the solid black line highlights the delay between the switch to O2, the removal of bridging
  CO species and the transient re-appearance of the bridging
  CO band at ca. 1,700 cm−1.

