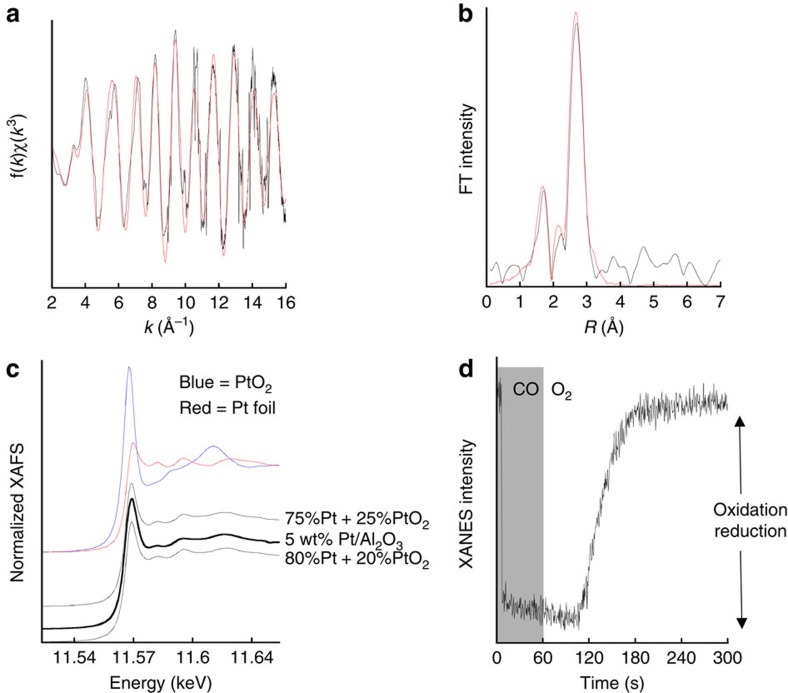
Figure 4. XAFS during periodic redox operation at 298 K.
(a) k3-weighted EXAFS derived in situ from the 5 wt% Pt/Al2O3 catalyst along with theoretical fit (red); (b) the corresponding Fourier transform (again with the theoretical fit in red). (c) Comparison of Pt L3 edge X-ray absorption near edge structure from this sample with that from Pt foil (red) and PtO2 (blue). The sample spectrum is also compared with linear combinations (80% Pt0 and 75% Pt0 as indicated) of these two reference spectra. (d) The temporal variation observed in the Pt L3 white line intensity during exposure of the catalyst to 5 vol% CO/Ar and then 21 vol% O2/Ar.

