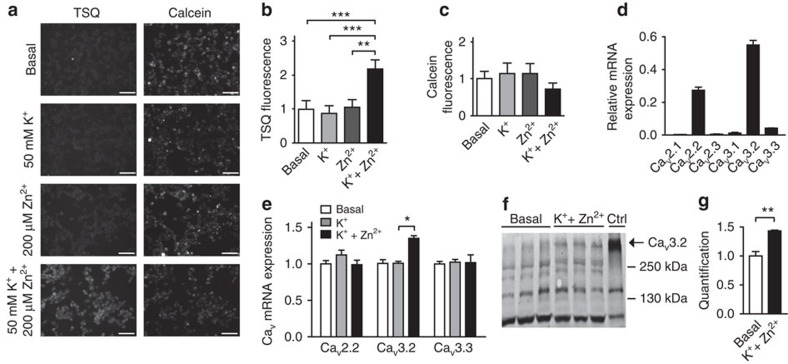
Figure 1. Zn2+ increases mRNA and protein expression levels of the T-type Ca2+-channel CaV3.2.
(a) Representative images of the membrane-permeant fluorescent Zn2+ indicator TSQ (left row) and calcein red-orange AM fluorescence (right row) in control NG108-15 cultures (basal) and after stimulation with K+ (50 mM), Zn2+ (200 μM) or K++Zn2+ (50 mM/200 μM). Scale bar, 100 μm. (b) Quantification of TSQ and (c) calcein red-orange fluorescence after incubation with K+, Zn2+ or K++Zn2+ normalized to control cultures (basal). Fluorescence intensity was quantified, background corrected for single cells and then averaged for every field of view. Normalization was performed for simultaneously treated and measured cultures (n=5 in two independent experiments; **P≤0.01; ***P≤0.001; repeated measures analysis of variance (ANOVA), multiple Bonferroni's multiple comparison test). (d) Relative mRNA expression of the voltage-dependent calcium channels in NG108-15 cells. Only CaV2.2, CaV3.2 and CaV3.3 are expressed above background levels. (e) Quantitative RT–PCR for CaV2.2, CaV3.2 and CaV3.3 mRNA levels in NG108-15 cells stimulated with K+ or K++Zn2+. mRNA expression was measured 4 h after stimulation, with synaptophysin as reference gene (one-way ANOVA: P=0.0142; F(8,27)=3.045; Tukey's multiple comparisons test, *P≤0.05; n=4). (f) Immunoblot for the ∼260 kDa CaV3.2 protein in NG108-15 cells 3 days after incubation basal or K++Zn2+ solutions (50 mM/200 μM). As a control, HEK-293 cells stably expressing CaV3.2 were probed. (g) Quantification based on α-tubulin levels (t-test: **P≤0.01; n=3).

