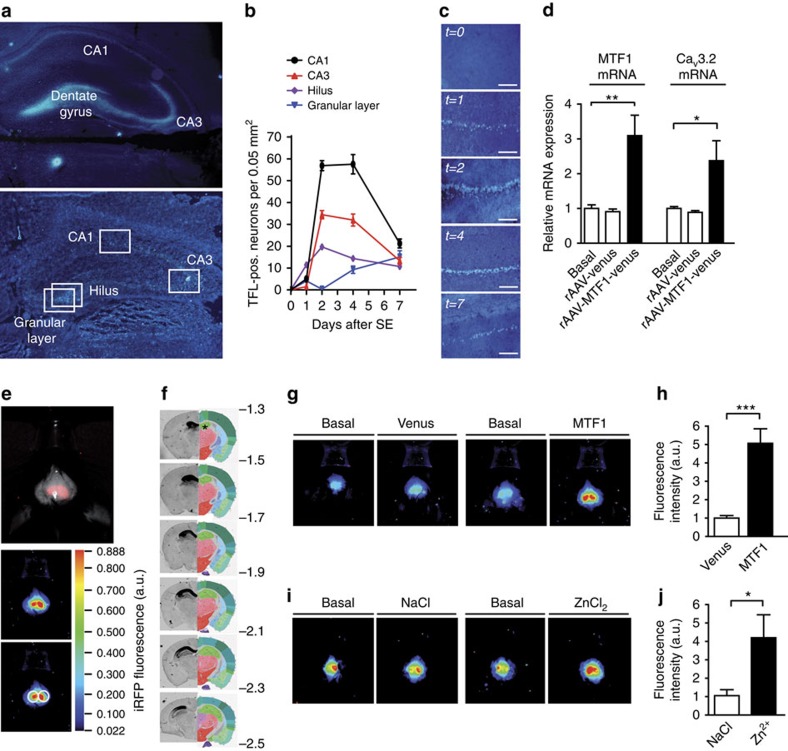
Figure 6. The Zn2+–MTF1–CaV3.2 cascade contributes to CaV3.2 upregulation.
(a) TFL-Zn2+ staining of the hippocampal region in the pilocarpine-SE model in rats under basal conditions (upper panel) and 2 days after SE (lower panel). White boxes represent the grids for differential counting in four distinct areas (CA1, CA3, hilus and the granular layer of the dentate gyrus (DG)). (b) Quantification of TFL-positive neurons in hippocampal CA1, CA3 and DG at various time points after SE (n=3 rats per time point; 39 slices). (c) Representative examples of TFL-Zn2+ staining in the CA1 area under basal conditions and 1, 2, 4 and 7 days after SE. Scale bar, 50 μm. (d) Quantitative RT–PCR on total hippocampi isolated from control, rAAV-Venus and rAAV-MTF1-Venus-injected mice. Expression levels were measured 14 days after injection, with synaptophysin as reference gene (one-way analysis of variance: P<0.001; F(5,18)=12.32; Tukey's multiple comparisons test, *P≤0.05, **P≤0.01; n=3). (e) Near-infrared in vivo imaging. Upper panel: representative example of in vivo iRFP signal of a recorded mouse with exposed skull. Middle panel: pseudo colour visualization of iRFP signals. Lower panel: regions of interest (ROIs) were defined above the hippocampal region and the surface radiance was defined in arbitrary units (a.u.). The colour bar indicates the total fluorescence efficiency. (f) iRFP fluorescence of coronal brain slices isolated from a rAAV-CaV3.2-iRFP-injected animal (left side: iRFP fluorescence intensity; right side: reference images from the Allen Mouse Brain Atlas (©2015 Allen Institute for Brain Science: http://mouse.brain-map.org), with the hippocampal region annotated with an asterisk (upper panel). Positions (in mm) are given relative to Bregma. (g) Representative example of a recorded rAAV-CaV3.2-iRFP mouse under basal conditions and 3 weeks after injection with rAAV-Syn-Venus (Venus) or rAAV-Syn-MTF1-IRES-Venus (MTF1). (h) Quantification of iRFP signals of rAAV-Syn-Venus (n=10)- and rAAV-Syn-MTF1-IRES-Venus (n=10)-injected animals (t-test: ***P≤0.001). (i) Representative example of a recorded rAAV-CaV3.2-iRFP mouse under basal conditions and 3 days after injection with 1 μl 0.9% NaCl or 1 μl 100 μM ZnCl2. (j) Quantification of iRFP signals of NaCl (n=8)- and ZnCl2 (n=8)-injected animals (t-test: *P≤0.05).

