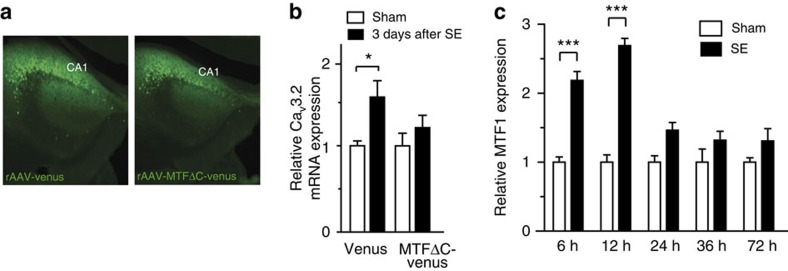
Figure 7. The Zn2+–MTF1–CaV3.2 cascade in the pilocarpine-SE model.
(a) Representative image of a rAAV-Venus- and rAAV-MTF1ΔC-Venus-injected animal. (b) mRNA expression of CaV3.2 in mice injected with rAAV-Venus (left) and rAAV-MTF1ΔC-Venus (right) 3 days after pilocarpine-induced SE (quantification based on synaptophysin; one-way analysis of variance (ANOVA): P=0.0335; F(3,26)=3.374; Tukey's multiple comparisons test, *P≤0.05; n=4). (c) MTF1 mRNA expression of hippocampal CA1 6, 12, 24, 36 and 72 h after pilocarpine-induced SE in mice (quantification based on synaptophysin; one-way ANOVA: P<0.001; F(9,39)=21.71; Tukey's multiple comparisons test, ***P≤0.001; n≥4).

