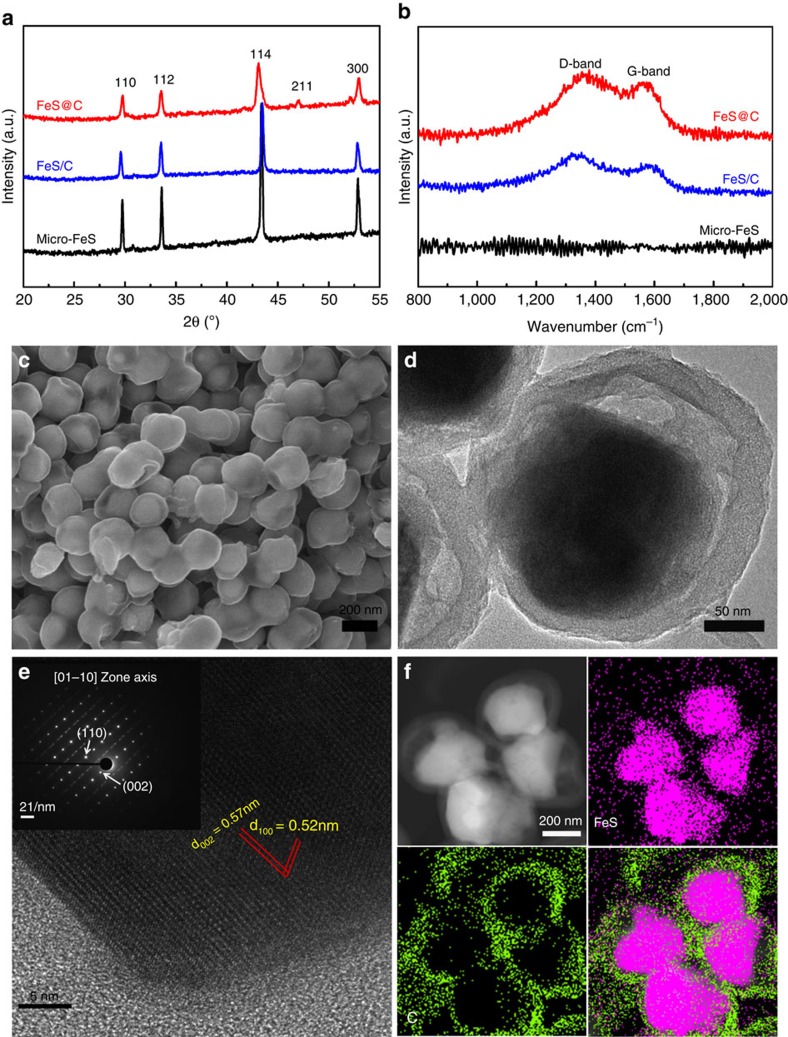
Figure 2. Physical characterization of the three samples.
(a) XRD patterns and (b) Raman spectra of the micro-FeS, core-shell FeS/C nanospheres and yolk-shell FeS@C nanospheres. (c) SEM, (d) TEM and (e) high-resolution TEM images with the corresponding SAED pattern (inset) and (f) scanning TEM (STEM) image with phase mapping for the yolk-shell FeS@C nanospheres.

