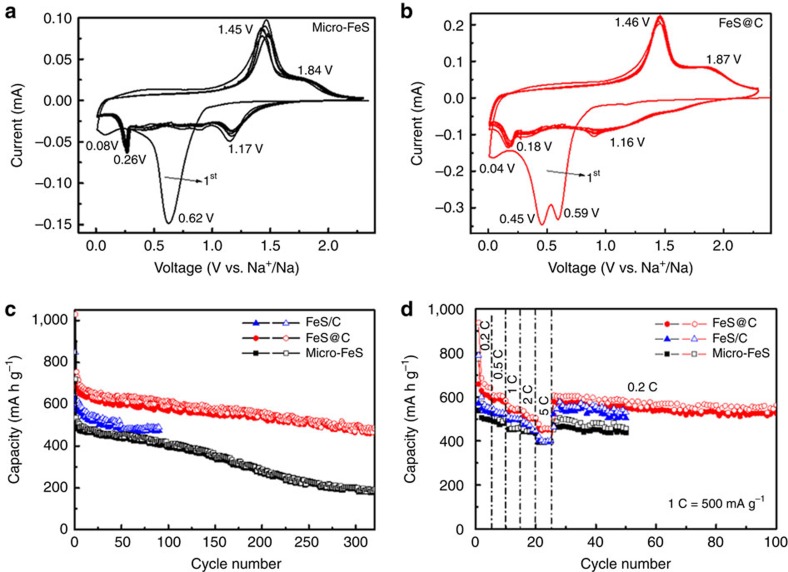
Figure 4. Electrochemical performance of all the samples.
Cyclic voltammograms of (a) the micro-FeS and (b) yolk-shell FeS@C nanospheres at the scan rate of 0.5 mV s−1; (c) cycling performances at 0.2 C (100 mA g−1); and (d) rate capability at various current rates of the micro-FeS, core-shell FeS/C nanospheres and yolk-shell FeS@C nanospheres.

