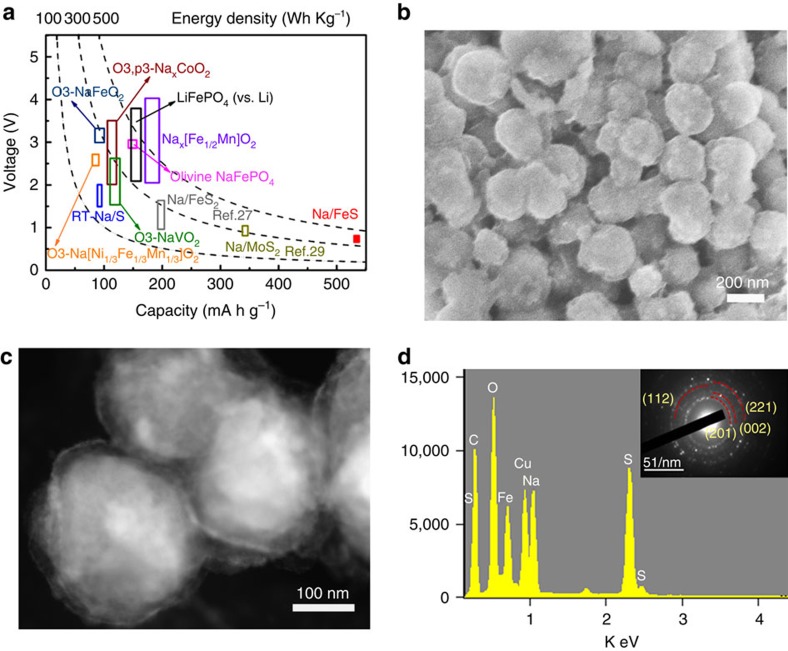
Figure 5. Superior energy density and morphological changes of the Na-FeS@C cells.
(a) Average voltage and energy density versus gravimetric capacity of sodium-storage technologies (LiFePO4 plotted for reference). (b) SEM image, (c) scanning TEM image and (d) corresponding energy-dispersive spectroscopy spectrum and SAED pattern (inset) of the yolk-shell FeS@C electrode after 50 cycles at the current rate of 0.2 C.

