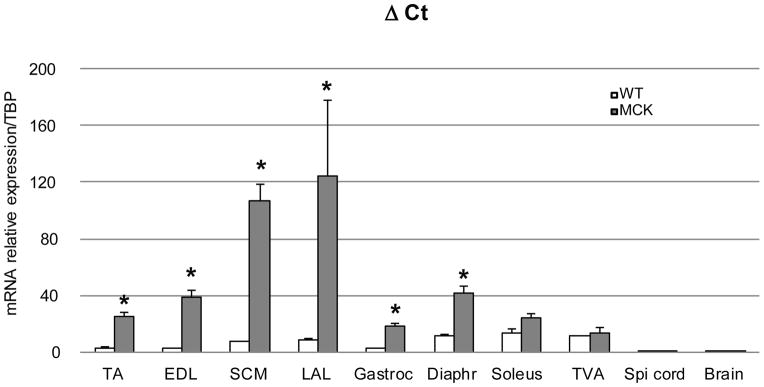
Figure 1. Level of expression of PGC-1α in different muscles from WT and MCK mice.
Relative PGC-1α mRNA levels in tissues from WT (white bars, n=3) and MCK- PGC-1α mice (grey bars, n=3) (6- to 8-weeks old). Total RNA was reverse transcribed and the level of expression of PGC-1α was determined by real-time PCR, relative to the TATA-Binding Protein (TBP) expression level, analyzed according to the ΔCt method. Each bar represents mean ± SEM. * p<0.05 (n=3, t test two tails) TA: tibialis anterior, EDL: extensor digitorum longus, SCM: sternocleidomastoidian, LAL: levator auris longus, Gastroc: gastrocnemius, Diaphr: diaphragm, TVA: transversus abdominis.

