. 2016 Mar 23;5:e13841. doi: 10.7554/eLife.13841

Figure 1. The CRL3 substrate adaptors SPOP and SPOPL are crucial for influenza A virus (IAV) infection and uncoating.

(A) siRNA screen workflow for BTB adaptor proteins with similar IAV infection phenotypes as CUL3 (left). Schematic representation of the CRL3SPOP/L E3 ubiquitin ligase complex (right). CUL3 mediates the formation of ubiquitin chains (UB) to its substrates by binding to the ubiquitin charged conjugating enzyme (E2-UB) via RBX1 on one side while allowing the interaction with the substrate through the substrate adaptor proteins SPOP or SPOPL on the other side. (B) IAV X31 infection assay. Images show A549 cells treated with control siRNA (siControl) or siRNA-depleted of CUL3 (siCUL3), and the BTB-adaptor SPOP (siSPOP-1) or SPOPL (siSPOPL-1) for 72 hr before infection with IAV X31. IAV infection was quantified by co-staining the cells with NP specific antibodies and DAPI to indicate nuclei. Cells siRNA-depleted for the vATPase subunit ATP6V1B2 (siATP6V1B2) were included for positive control. Scale bar = 100 μm; Data are mean + SD, n > 100 cells per sample, N = 4. (C-G) IAV entry assays. A549 cells were treated with control, SPOP- or SPOPL-specific siRNA, and binding of IAV X31 to the cells was monitored by immunofluorescence staining of the hemagglutinin (HA) with anti-H3 antibody (C). The IAV infection was allowed for 0.5 hr to follow IAV endocytosis with HA staining (D), for 1 hr to monitor IAV acidification using A1 antibodies (E), for 2.5 hr to check IAV uncoating by M1 detection (F) and finally for 5 hr to track nuclear import of IAV vRNPs by NP-specific antibodies (G). Nuclei were stained with DAPI and entry steps quantified relative to control. Scale bar = 50 μm; Data are mean + SD, n > 500 cells per sample, N = 3. **p≤0.01, ***p≤0.001; ****p≤0.0001. (H) Acid-induced endocytic-bypass entry assay. IAV nuclear import after acid-induced fusion at the PM was monitored in A549 cells using indirect immunofluorescence staining for NP and counterstaining with DAPI for infection quantitation. Note that pH 5.4 allows acid-induced endocytic-bypass infection of IAV. Scale bar = 50 μm; Data are mean + SD, n > 500 cells per sample, N = 3.

DOI: http://dx.doi.org/10.7554/eLife.13841.003

Figure 1.

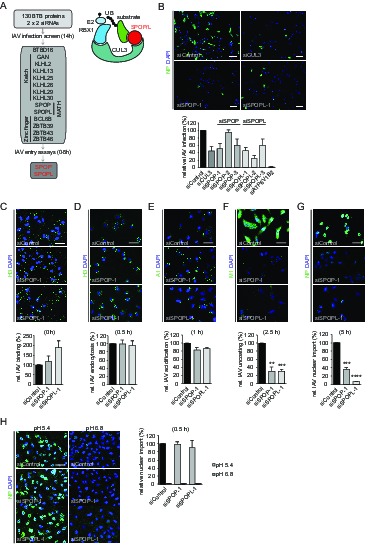
Figure 1—figure supplement 1. The CRL3 substrate adaptors SPOP and SPOPL are crucial for influenza A virus (IAV) infection and uncoating.

Figure 1—figure supplement 1.

(A) The efficiency of distinct siRNAs targeting SPOP (siSPOP-1 to siSPOP-3) or SPOPL (siSPOPL-1 to siSPOPL-3) were analyzed in HeLa cells by qRT-PCR (left panel). The qRT-PCR measurements were quantified and plotted as mRNA levels relative to GAPDH controls. Data are mean + SD, N = 3. Immunoblotting of cell extracts using an affinity-purified peptide antibody specifically recognizing SPOPL (right panel, see Material and methods). (B) IAV X31 infection assay. HeLa cells treated with siControl, depleted of SPOP (siSPOP1-2), SPOPL (siSPOPL1-2), CUL3 (siCUL3) or the vATPase subunit ATP6V1B2 (siATP6V1B2) were infected with IAV X31, and infected cells were visualized by immunofluorescence staining of the viral protein NP. The assay was quantified as described in the legend to Figure 1 and plotted as percentage (%) of NP positive cells compared to control (siControl). Data are mean + SD, n > 500 cells per sample, N = 3. (C) IAV binding assay. A549 cells treated with siControl oligos or depleted as indicated for SPOP (siSPOP2-3), SPOPL (siSPOPL2-3), CUL3 (siCUL3) or the vATPase subunit ATP6V1B2 (siATP6V1B2) and incubated with the IAV X31 strain (MOI = 100) for 1 hr at 4°C. IAV binding was monitored by immunofluorescence staining of hemagglutinin (HA) with anti-H3 antibody, and quantified by plotting the relative percentage (%) of H3 positive cells treated with siSPOP or siSPOPL compared to siControl. Scale bar = 50 μm. Data are mean + SD, n > 100 cells per sample, N = 3. (D) IAV endocytosis assay. Following binding for 1 hr at 4°C, IAV X31 virus was internalized for 0.5 hr in control, SPOP- and SPOPL-depleted A549 cells. Intracellular staining of HA was used to monitor IAV endocytosis, and quantified by plotting the relative percentage (%) of cells with intracellular H3 treated with siSPOP or siSPOPL compared to siControl. Scale bar = 50μm. Data are mean + SD, n > 100 cells per sample, N = 3. (E) IAV acidification assay. Following binding for 1 hr at 4°C, IAV X31 virus was internalized for 1 hr in control, SPOP- and SPOPL-depleted A549 cells. Acidification of IAV was monitored by A1 immunofluorescence staining detecting the acid-induced conformational switch of HA after IAV entry. The data were quantified by plotting the relative percentage (%) of A1 positive cells treated with siSPOP or siSPOPL compared to siControl. Scale bar = 50 μm. Data are mean + SD, n > 100 cells per sample, N = 3. (F) IAV fusion assay. A549 cells treated for 72 hr with siControl oligos or depleted as indicated with three different siRNAs targeting SPOPL (siSPOPL1-3) or CUL3 (siCUL3) were incubated for 1 hr at 4°C with the IAV X31 strain (MOI = 100), labeled prior to this with R18 dye. The dye allows detecting fusion of the virus with the host membrane by changing its color from red to green. Viral fusion was quantified after 1 hr by FACS analysis and plotted as relative percentage (%) IAV fusion/hemifusion compared to siControl. Bafilomycin treatment for 1 hr prior to infection served as a control, since blocked vesicle acidification inhibits HA acidification and thus IAV fusion, but not endocytosis. Data are mean + SD, n > 5000 cells per sample, N = 3. (G) IAV uncoating assay. Following binding for 1 hr at 4°C, IAV X31 virus was internalized for 2.5 hr in control, siSPOP and SPOPL-depleted A549 cells in the presence of CHX. Uncoating of IAV particles was detected by immunofluorescence staining against M1. Dispersed M1 staining in the cytoplasm represents a successful uncoating event, and was quantified by plotting the relative percentage (%) of M1-dispersed cells treated with siSPOP or siSPOPL compared to siControl. Scale bar = 50 μm. Data are mean + SD, n > 100 cells per sample, N = 3. (H) IAV nuclear import assay. Following binding for 1 hr at 4°C, IAV X31 virus was internalized for 2.5 hr in control, SPOP- and SPOPL-depleted A549 cells in the presence of CHX. Import of NP into the nucleus was detected by indirect immunofluorescence staining with anti-HB64 antibody, and quantified by plotting the relative percentage (%) of nuclear NP-positive cells treated with siSPOP or siSPOPL compared to siControl. Scale bar = 50 μm. Data are mean + SD, n > 100 cells per sample, N = 3.