
Fig. 2. Experimental measurement of the TTM.
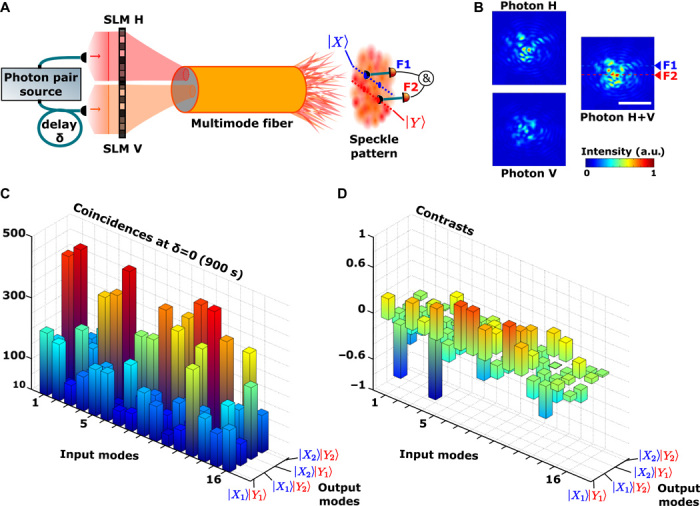
(A) Schematic of the experimental setup using a two-photon state injected into two different transverse spatial modes. (B) Recorded intensity images of the corresponding output speckle patterns for photon H only, photon V only, and H+V simultaneously, containing about 50 independent speckle grains. The scale bar represents 25 μm in the output plane of the MMF. The H+V speckle pattern corresponds to the incoherent sum of each individual case. (C) Coincidence detection patterns between F1 and F2 reconstructed for 16 two-photon input states programmed by the SLMs. F1 and F2 scan four output coincidence positions denoted |X1Y2〉, |X1Y2〉, |X1Y2〉, |X1Y2〉. The 16 × 4 coincidence matrix measured here represents a subset of the complete TTM that consists of approximately (380 × 380)2 elements. (D) For the same 16 × 4 elements, the differences observed in coincidence patterns measured with distinguishable (δ = 0.4 mm) or indistinguishable (δ = 0) photons are quantified by reconstructing the nonclassical contrast matrix. A contrast is given by the formula C = (Rδ=0 − Rδ=0.4 mm)/Rδ=0.4 mm, where Rδ is the coincidence rate of a two-photon output state at a path length difference of δ. This matrix is a clear signature of quantum interference effects occurring in the MMF. Coincidences are monitored for 900 s with a coincidence window of 2.5 ns.