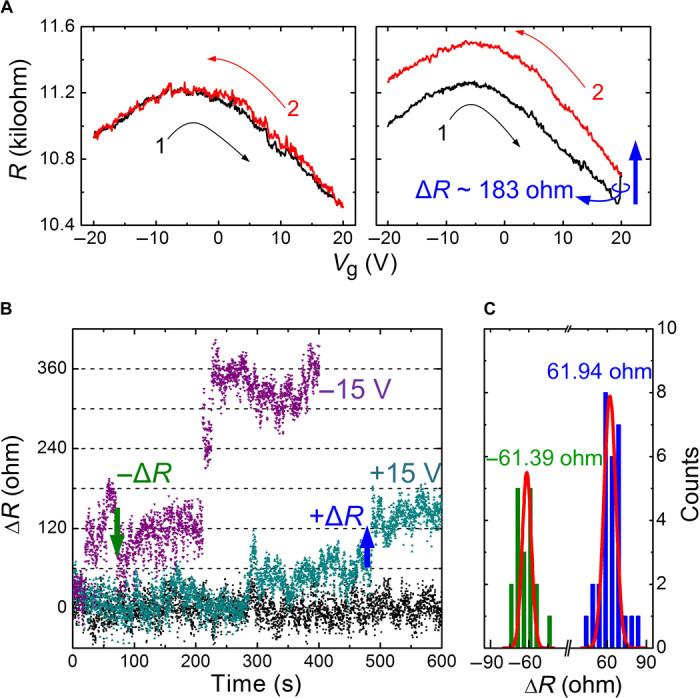
Fig. 2. Measurements of CO2 detection with the suspended BLG.

(A) Gate modulations in a vacuum (left) and in a CO2 environment (right). (B) Resistance responses of BLG exposed to CO2 with Vg of 0 V (black dots), +15 V, and −15 V, respectively. The blue and green arrows highlight the positive and negative step-like changes in resistance, respectively. (C) Statistical distribution of the step-like change in resistance ΔR in BLG exposed to CO2 with a Vg of +15 V. The solid lines are Gaussian fits.
