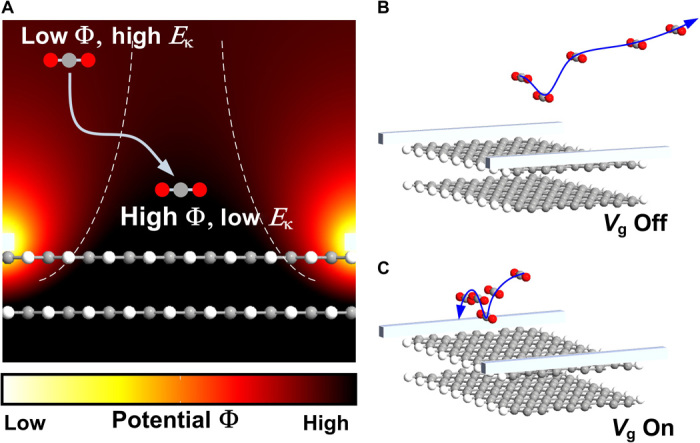
Fig. 3. Molecular dynamics simulations of CO2 motion over a graphene surface in an electric field.

(A) Potential distribution on the graphene surface with the application of back-gate voltage. The area with high potential is located between the two dashed lines. (B and C) Molecular dynamics simulations of the trajectory of a free CO2 molecule near the graphene surface at 300 K from 0 to 4 ps without (B) and with (C) Vg. The arrow lines give the trajectory of the molecule.
