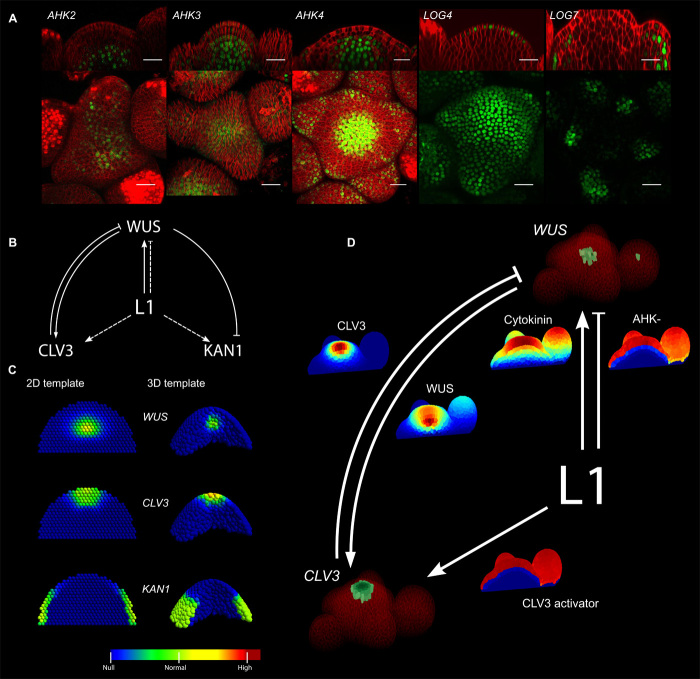
Fig. 1. The epidermis-driven model reproduces the wild-type gene expression patterns.
(A) Expression domains of cytokinin receptors (AHK2, AHK3, AHK4), and cytokinin-activating enzymes (LOG4, LOG7) in green (fluorescent protein markers, Supplementary Materials) together with plasma membranes in red (FM4-64 dye). Scale bars, 20 μm. (B) Representation of the model. Solid lines indicate interactions supported by molecular evidence, whereas dashed lines show interactions supported by indirect evidence. (C) Optimized domains of WUS, CLV3, and KAN1 in two-dimensional (2D) (left) and 3D (right) abstract representations of the tissue. Gene expression intensity is color-coded. (D) Optimized domains of CLV3 and WUS in a segmented tissue obtained from confocal microscopy. Gene expression domains from the simulation are shown in green, and plasma membranes are shown in red (FM4-64 dye). The diffusive signal concentrations are displayed with the color map of (C) (minimum, blue, to maximum, red). Model equations are defined in the Supplementary Materials, and model parameter values are given in table S1.

