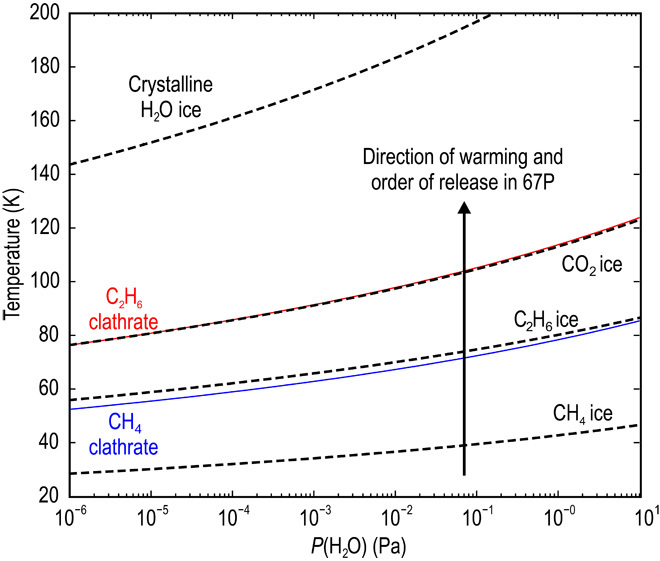
Fig. 2. Equilibrium curves of clathrates and pure condensates in the cometary environment.

The equilibrium curves are shown here as a function of total H2O pressure. Decomposition of the clathrate structures and sublimation of pure ices occur at temperatures above the equilibrium curves, whereas clathrates/pure condensates remain stable below the curves. Mole fractions of each species shown are directly taken from ROSINA/DFMS measurements of the coma of 67P (14).
