
Fig. 3. Segregation of ori2 (but not ter2) occurs earlier when crtS is transposed near ori1.
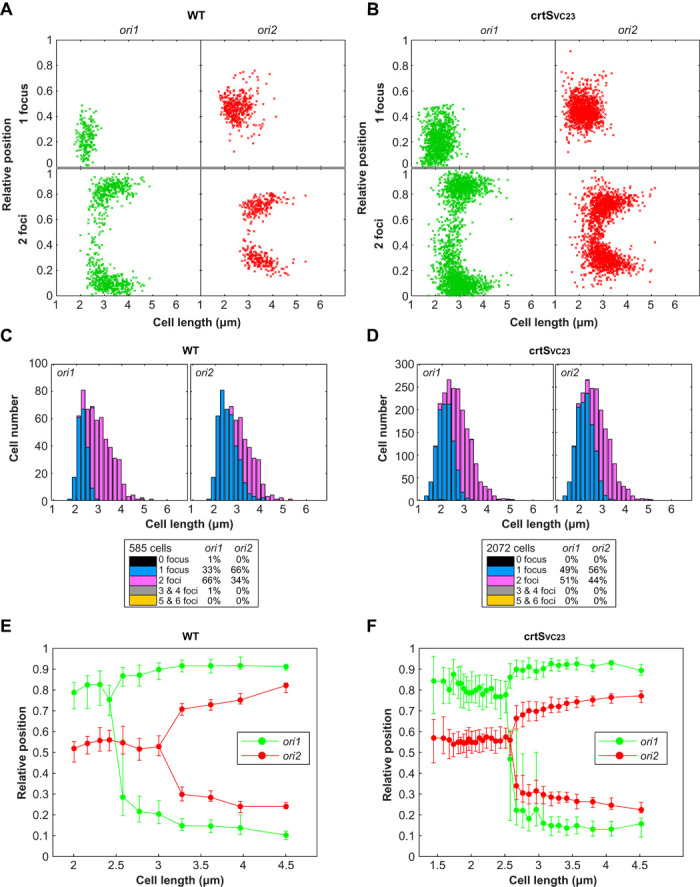
(A and B) Plot showing the position of ori1 (left panel) and ori2 (right panel) foci inside WT (A) and mutant crtSVC23 (B) cells. Foci are oriented longitudinally relative to the old pole of the cell as a function of cell length. The old pole of the cells was defined as the closest pole to an ori1 focus. The x axis represents the cell length (in micrometers). The y axis represents the relative position of the focus in bacterial cells, 0 being the old pole and 1 the new pole. Snapshot images of 585 WT and 2072 crtSVC23 mutant cells were analyzed. (C and D) Histograms displaying the amount of cells that exhibit zero, one, two, three, four, or five and six fluorescent foci according to cell size (in micrometers) in WT (C) and mutant crtSVC23 (D) cells. (E and F) By correlating the longitudinal position of ori1 and ori2 foci as a function of cell length, the segregation choreographies of the ori1 and ori2 were reconstituted throughout the cell cycle of WT (E) and mutant crtSVC23 (F) bacterial cells. Cells were classified according to their size and grouped by 30 to define each size interval. For most loci and cell length intervals, there were cells with either a single focus or two separated foci, the relative proportions of each type varying as a function of cell length. Only the position of the foci corresponding to the dominant cell type in each cell length interval was plotted. The median positions of the observed foci (filled circles), along with the 25th to 75th percentiles (error bars), were plotted for each cell size bin. The x axis represents the cell length (in micrometers). The y axis represents the relative position of the focus in bacterial cells (0, new pole and 1, old pole).