
Fig. 5. Intra- and interchromosomal interactions in V. cholerae.
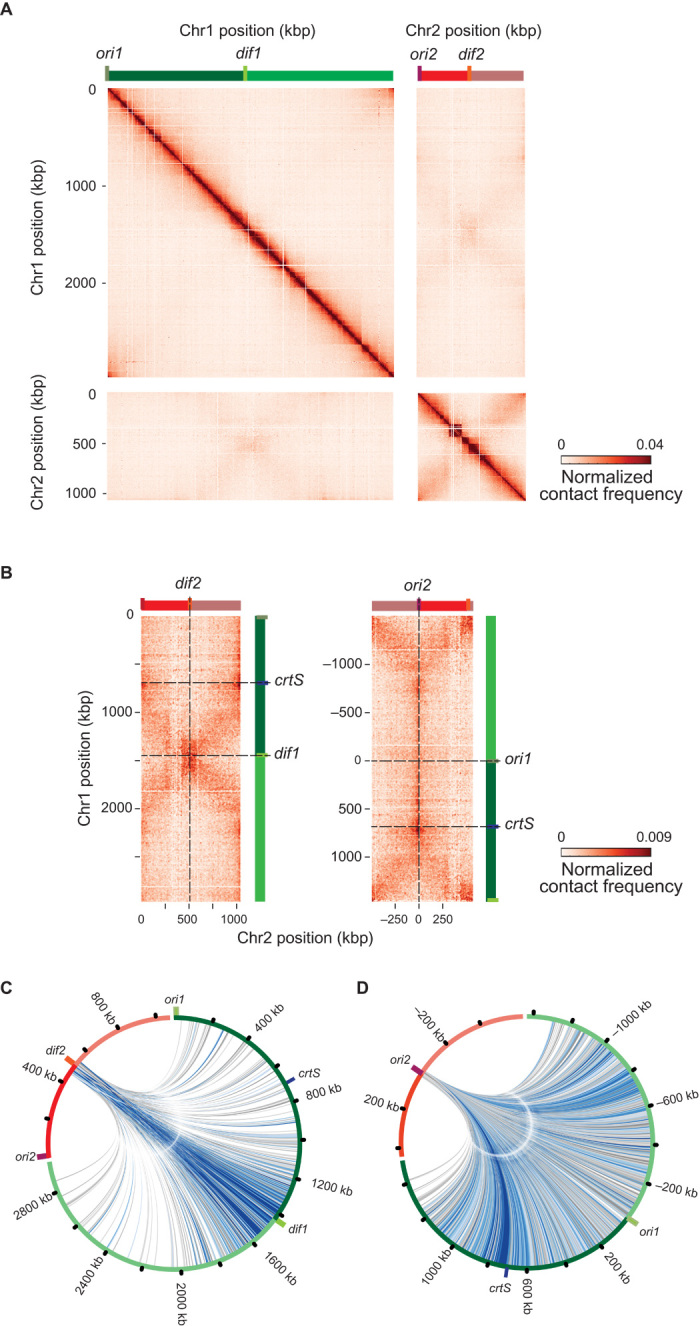
(A) Normalized and filtrated genomic contact map obtained from an asynchronous population of WT cells growing exponentially in LB. x and y axes represent genomic coordinates of each chromosome centered on dif sites (light green bar, dif1; orange bar, dif2). Origins of replication are shown as a dark green bar (ori1) and a dark red bar (ori2). Chr1 and Chr2 are represented by dark green (right arm) or light green (left arm) and dark red (right arm) or light red (left arm). The color scale reflects the frequency of contacts between two regions of the genome (arbitrary units), from white (rare contacts) to dark red (frequent contacts), and is conserved across all panels of all figures. (B) Interchromosomal contact map centered on dif (left panel) or ori sites (right panel). The crtS site is indicated as a blue bar. (C and D) Circos representation of interactions of 100 kbp (20 bin) around dif2 with Chr1 (C) and circos representation of interactions of 50 kbp (10 bin) around ori2 with Chr1 (D).