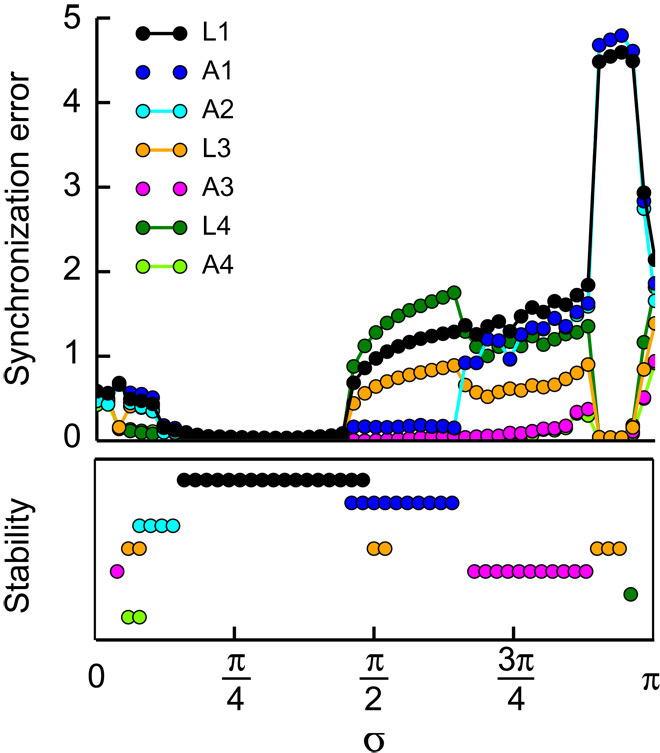
Fig. 4. The figure shows the experimental synchronization error for each synchronization pattern as a function of the parameter σ for a five-node experimental system modeled after Fig. 2.

Underneath the top portion, we plot the results of our stability analysis applied to each one of the CS patterns, where a colored dot labels the values of σ for which the corresponding pattern is stable.
