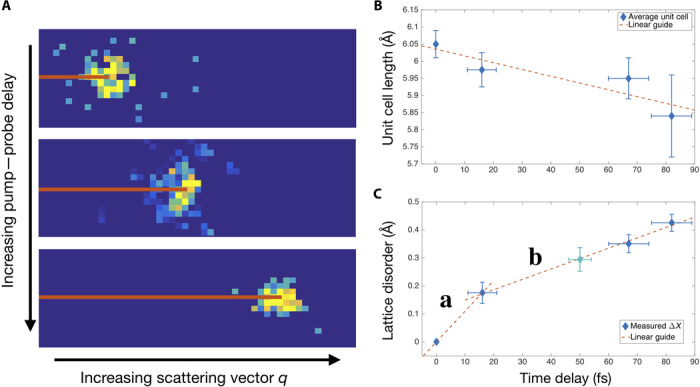
Fig. 2. Evidence for atomic motion on the few-femtosecond time scale.

(A) Bragg peaks from the (220) fcc reflection plane shift to higher scattering vector q with increasing pump-probe delay (0-, 60-, and 80-fs delays pictured here). (B) The average unit cell lengths measured from the q value for the (111) and (220) fcc reflection planes show a consistent decrease with increasing delay. (C) Apparent lattice disorder is calculated from the DWF. Two distinct regimes show a fast disorder (region a) on the same time scale as electronic responses, and a slower change (region b) indicative of lattice distortion. The teal marker is for the 50-fs delay average data set where single-shot data could not be filtered on single-grain clusters.
