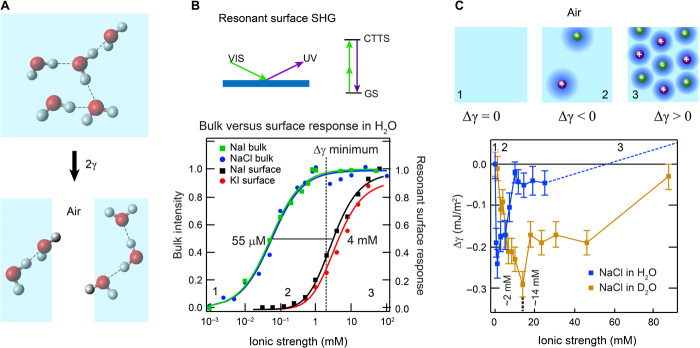
Fig. 3. Macroscopic manifestation of orientational order in the H-bond network of aqueous electrolyte solutions.
(A) An illustration of the concept of surface tension. (B) Normalized resonant I− surface second harmonic response of NaI and KI (|χ(2)|2; black and red data) (52) and normalized fs-ESHS (bulk) intensity change originating from constraints in the orientational order of bulk water (blue and green data). Ion-induced changes in the H-bond network of bulk water occur at lower concentrations (55 μM) than the surface adsorption (4 mM). The saturation of the bulk structural changes coincides with the minimum in Δγ (dashed line). The top panel shows an illustration of resonant surface SHG. VIS, visible; UV, ultraviolet; GS, ground state. (C). Measured surface tension difference (Δγ) for NaCl solutions of H2O (blue data) and D2O (brown data). Above 20 mM, Δγ increases, as indicated by the dashed line [see Jarvis and Scheiman (53)]. A cartoon illustrating the structural changes in the electrolyte solution is shown on top. The numbers correspond to the different regimes of ionic strength and are also indicated in (B).

