
Fig. 3. MD simulation of the inaZ ice-active site.
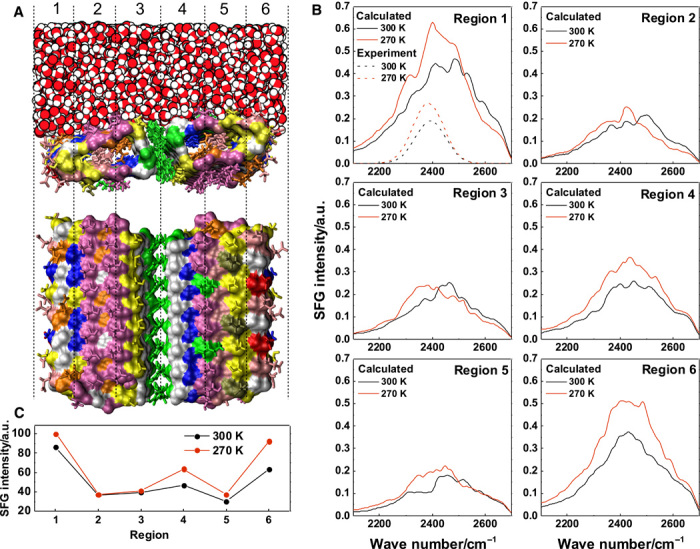
(A) The top view illustrates the ladder-type regions of groups of amino acids on the IN dimer. The side view shows an MD snapshot of the water structure at the IN site. Together, side chains and clathrate water form a template for ice nucleation. Threonine, purple; serine, yellow; alanine, blue; tyrosine, green; glutamic acid, orange; glycine, white. (B) Calculated SFG spectra for regions with different amino acids present. Thr- and Ser-rich areas leave the water signal intensity unchanged, whereas there is a clear trend toward a stronger water signal near glutamic acid– and serine-rich regions. (C) Integrated SFG intensity for the IN site regions at 270 and 300 K. The increased intensity at regions 1 and 6 indicates more ordered water near the perimeter of the IN site.