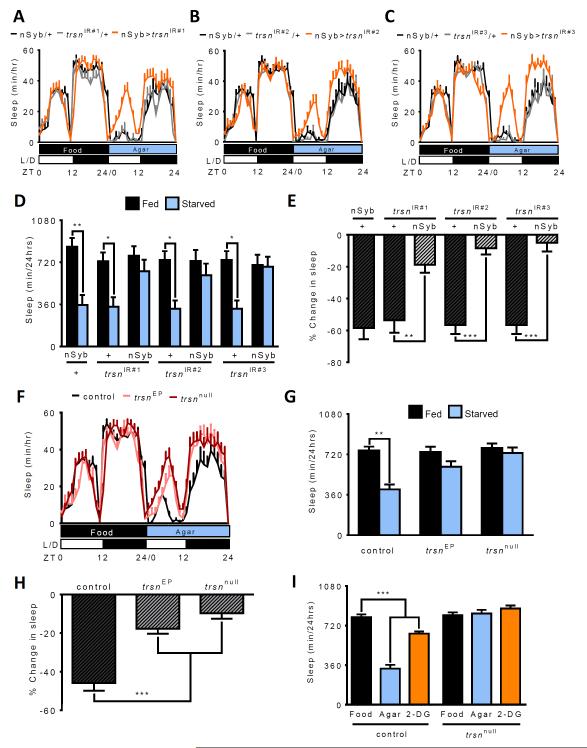
Figure 1. trsn is required for metabolic regulation of sleep.
A-C. Sleep profile for hourly sleep averages over a 48 hour experiment. Flies are on food for day 1, then transferred to agar for day 2. Sleep does not differ between any of the groups for day 1. The trsn knockdown groups (nSyb>trsn; orange) sleep more than nSyb-GAL4/+ (black) and trsnIR/+ controls (grey) during day 2 (starved). D Control flies (nSyb-GAL4/+ and trsnIR/+) sleep significantly more on food (black) than when starved (blue, N≥36; P<0.001) while no signficant differences in sleep duration are observed in flies where nSyb-GAL4 drives expression of trsnIR#1 (N=45; P>0.98), trsnIR#2 (N=45; P>0.99), or trsnIR#3 (N=36; P>0.98). E. Quantifying the percentage change in sleep between fed (day 1) and starved (day 2) states reveals sigificantly greater sleep loss in nSyb-GAL4/+ controls (nSyb-Gal4/+ vs trsnIR#1/+, N≥38; P>0.95; nSyb-Gal4/+ vs trsnIR#2/+, N≥39; P>0.99; nSyb-Gal4/+ vs trsnIR#3/+, N≥37; P>0.99) compared to all three lines with neuronal expression of trsnIR#1(N≥38; P<0.01), trsnIR#2 (N≥39; P<0.001) and trsnIR#3 (N≥36; P<0.01). F. Sleep profile over 48 hours reveals that sleep in trsnEP and trsnnull does not differ from w1118 control flies on food. Both trsnEP and trsnnull mutant flies sleep more than control flies on agar. G. Sleep is significantly reduced in starved control flies (N≥54; P<0.001), while sleep differences are not significant in trsnEP (N=69; P>0.23) or trsnnull flies (N=58; P>0.98). H. Percentage sleep loss is also significantly reduced in trsnEP and trsnnull mutants compared to controls (N≥54; P<0.001). I) In control flies, sleep is significantly reduced in flies on agar (blue; N=44; P<0.001) or food laced with 2-deoxyglucose (2-DG; orange) (N≥64; P<0.001), compared to flies fed standard food (black). No differences are detected between flies fed standard food compared to agar or 2-DG in trsnnull mutants (N≥38; P>0.70). Bars for % change in sleep are mean ± SEM by one-way ANOVA. All other bars are mean ± SEM; P<0.01,**; P<0.001,*** by 2-way ANOVA. See also Figure S1.

