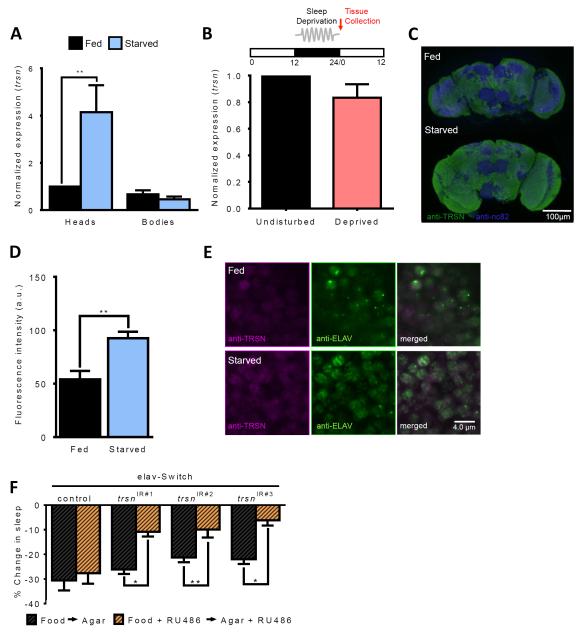
Figure 3. Spatial and temporal localization of trsn function.
A. Expression of trsn is upregulated in the heads (N≥14; P<0.01) but not bodies of w1118 control flies (N≥14;P>0.99) following 24 hours of starvation. B. trsn transcript does not differ in heads between flies sleep-deprived for 12 hours from ZT12-ZT24 and undisturbed controls (N=3; P>0.17). Red arrow denotes point of tissue collection. C,D. Immunohistochemistry for whole-brain TRSN protein (B). Neuropils are labeled by NC82 for reference (magenta) and anti-TRSN (green) is observed throughout the brain. Whole-brain TRSN protein quantification of fluorescence intesity revealed TRSN is increased in starved flies compared to fed control (N≥6; P<0.002) by paired t-test. E. Immunostaining for anti-TRSN (magenta) and the neuronal marker anti-ELAV (green) reveals colocalization between TRSN and ELAV proteins in brains of fed (upper) and starved (lower) flies. Depicted is a representative section from the dorsomedial central brain, near the lateral horn region. Scale bar denotes 4 μm. F. Percentage sleep loss in experimental flies treated with RU486 (orange bars) or controls without drug treatment (black bars). Sleep suppression is significantly reduced in elav-Switch>trsnIR#1 flies (N≥36; P>0.031), elav-Switch>trsnIR#2 (N≥68; P<0.011) and elav-Switch>trsnIR#3 (N≥34; P<0.041) flies fed RU486 compared to non-RU486-fed controls. There is no effect of RU486 feeding in flies harboring the elav-Switch transgene alone (N≥39; P>0.99). All other bars are mean ± SEM; P<0.05,*; P<0.01,**; by 2-way ANOVA. See also Figure S3.

