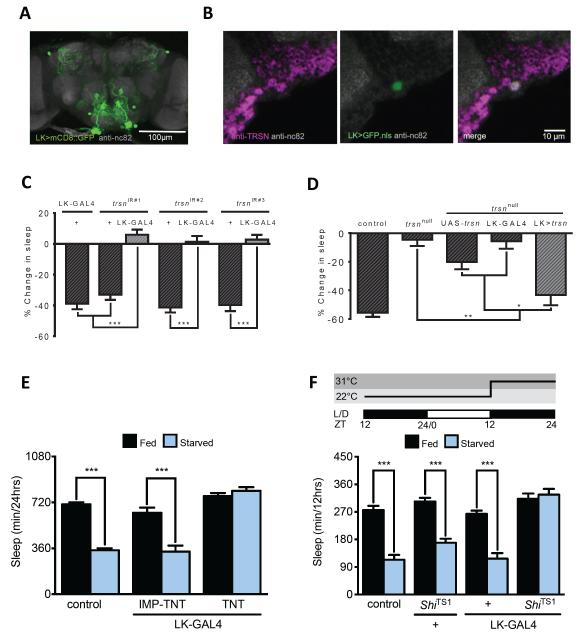
Figure 4. trsn functions in Leucokinin neurons to regulate sleep.
A. Whole-brain confocal reconstruction of LK-GAL4>mCD8::GFP. GFP-expressing neurons (green) labeled the subeosphogeal zone and dorsal protocerebrum. The brain was counterstained with the neuropil marker nc82 (grey). Scale bar denotes 100 μm. B. Immunostaining for anti-TRSN (magenta) in the brain of LK-GAL4>UAS-GFP.nls reveals TRSN localizes to neurons labeled by LK-GAL4 (white). Depicted is a representative 2 μm section from the lateral horn region. Scale bar denotes 10 μm. The neuropil marker anti-nc82 (grey) is used as background. C. Knockdown of trsn in LK-GAL4 neurons alone reduces starvation-induced sleep suppression in all three trsnIR lines compared to control flies harboring a UAS-trsnIR transgene alone (N≥52; P<.001) or LK-GAL4 transgenes alone (N≥64; P<0.001). D. Expression of UAS-trsn under LK-GAL4 control in the background of a trsnnull mutation restores starvation-induced sleep suppression compared to flies harboring either UAS-trsn (N=87; P<0.05); or the GAL4 lines alone (N=79; P<0.01). No significant differences were detected between LK rescue and w1118 control flies (N≥38; P>0.10). E. Starvation-induced sleep suppression is abolished in flies expressing TNT in LK-GAL4 neurons (LK-GAL4>UAS-TNT, Fed vs Starved N=39; P=0.96) while controls expressing inactive UAS-IMP-TNT suppress sleep (Fed vs. Starved: LK-GAL4>UAS-IMP-TNT, N=33, P<0.001). Sleep duration on food does not differ significantly between LK-GAL4>UAS-TNT and UAS-IMP-TNT flies N≥34, P>0.06). F. Flies were transferred to agar at ZT9 then sleep was measured at 31°C on food (black) or agar (blue) over the 12hr night (ZT12-ZT24). Genetic silencing of LK-GAL4 abolished starvation-induced sleep suppression (LK-GAL4>UAS-ShiTS, Fed vs Starved, N≥40, P>0.98) while control flies robustly suppressed sleep (Fed vs Starved: control, N≥79, P<0.001; UAS- ShiTS1 /+, N≥42, P<0.0001; LK-GAL4/+, N≥51, P<0.002). No differences were observed between genotypes in the fed state (Fed vs Fed: control vs LK-GAL4>UAS-ShiTS , P>0.72; UAS-ShiTS/+ vs LK-GAL4>UAS-ShiTS , P>0.98, LK-GAL4/+ vs LK-GAL4>UAS-ShiTS, P=0.07). All columns are mean ± SEM; P<0.01,**; P<0.001,*** by 2-way ANOVA. See also Figure S4.

