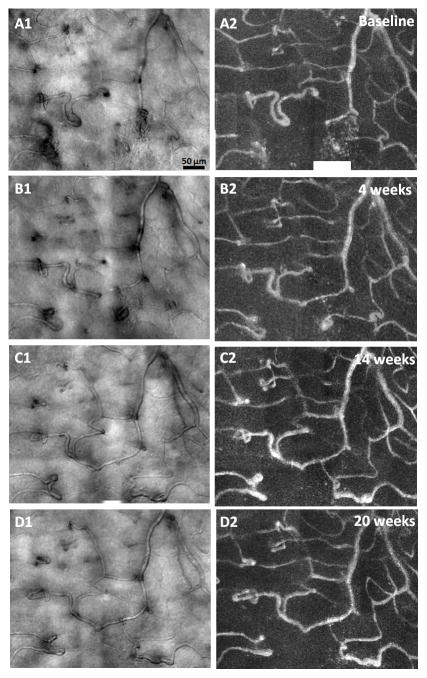
Figure 4.
Longitudinal microvascular changes in PDR. AOSLO structural images (left column) and motion contrast perfusion maps (right column) obtained approximately 2° superior to the fovea. Imaged region corresponds to the yellow box on Figure 1A. Vessel abnormalities such as nonperfused capillary, microaneurysm, and capillary loops are visible. Scale bar = 50 μm across. Selected regions are shown in higher magnification in Figures 5–8.

