
Figure 7.
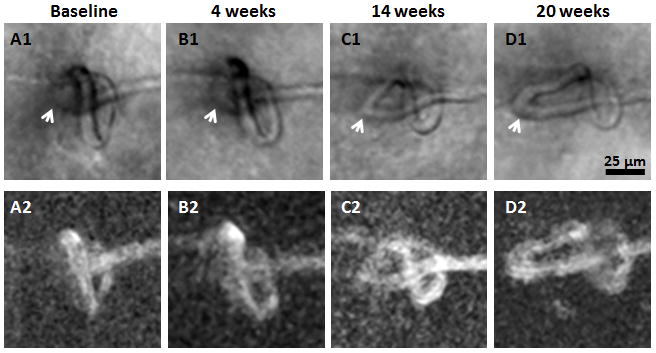
Formation of capillary bends. Magnified region from Figure 4. Top row shows AOSLO structural images. Bottom row shows corresponding motion contrast perfusion maps. Arrows indicate the formation of capillary bends. Scale bar = 25 μm across.
Official websites use .gov
A
.gov website belongs to an official
government organization in the United States.
Secure .gov websites use HTTPS
A lock (
) or https:// means you've safely
connected to the .gov website. Share sensitive
information only on official, secure websites.
Formation of capillary bends. Magnified region from Figure 4. Top row shows AOSLO structural images. Bottom row shows corresponding motion contrast perfusion maps. Arrows indicate the formation of capillary bends. Scale bar = 25 μm across.