Figure 9.

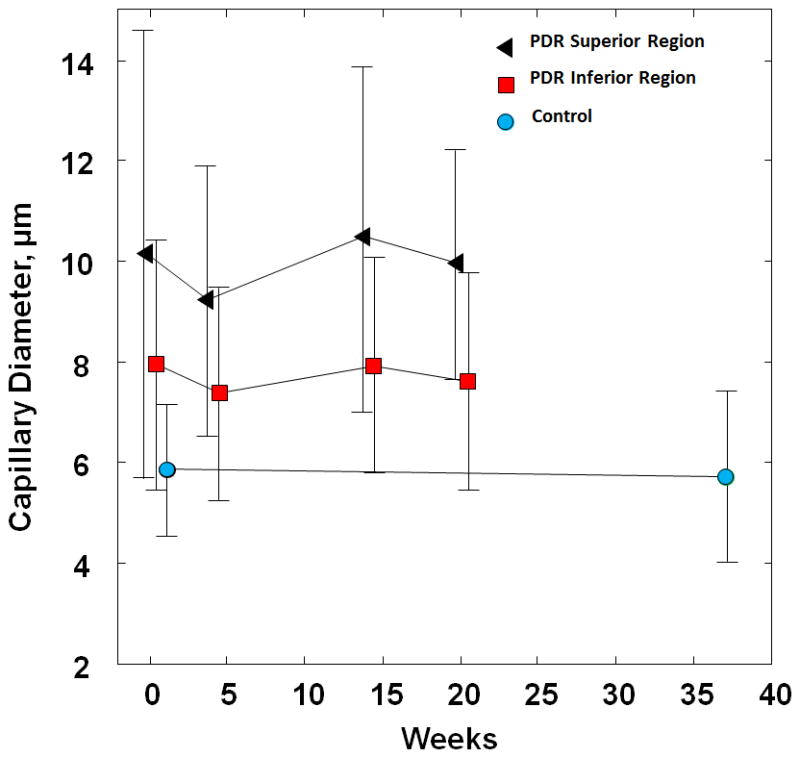
Capillary diameter measurements over time in the PDR patient and healthy control. Error bars represent standard deviation. Square and circle data points have been displaced slightly to the right for better visualisation of the error bars.

Capillary diameter measurements over time in the PDR patient and healthy control. Error bars represent standard deviation. Square and circle data points have been displaced slightly to the right for better visualisation of the error bars.