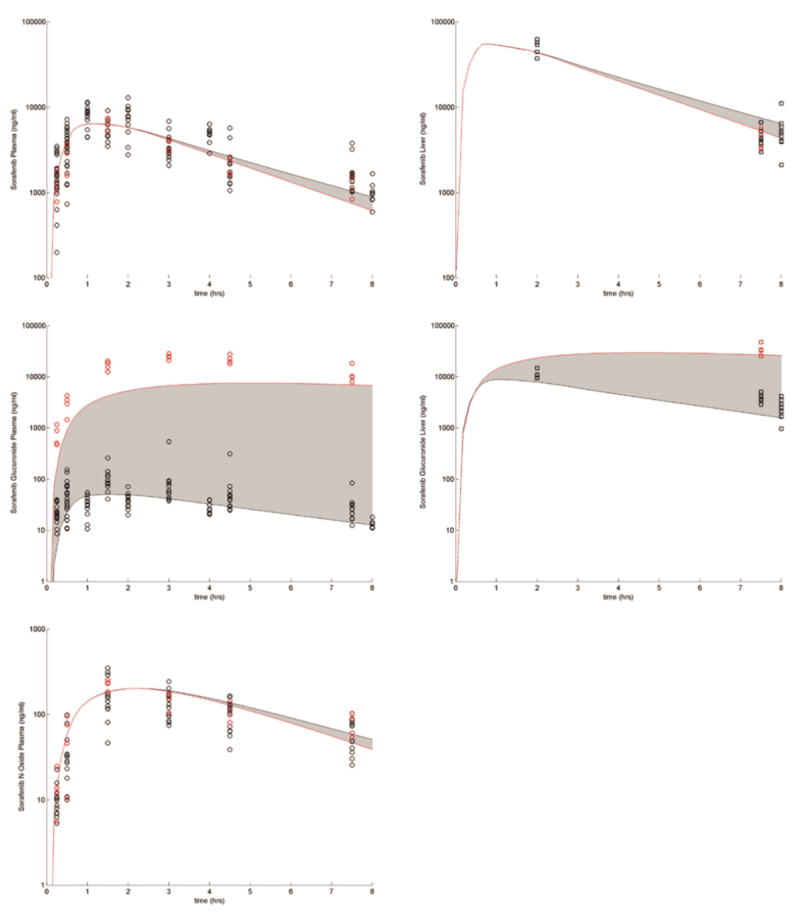
Figure 6.
Sorafenib and SG efflux via Abcc2. Black circles and curve: WT; Red circles and curve: Abcc2 KO. The shaded region shows the variability in the disposition when SG Abcc2 activity is decreased from baseline value to 0 and another undefined sinusoidal membrane efflux transporter’s activity is increased 2 fold.

