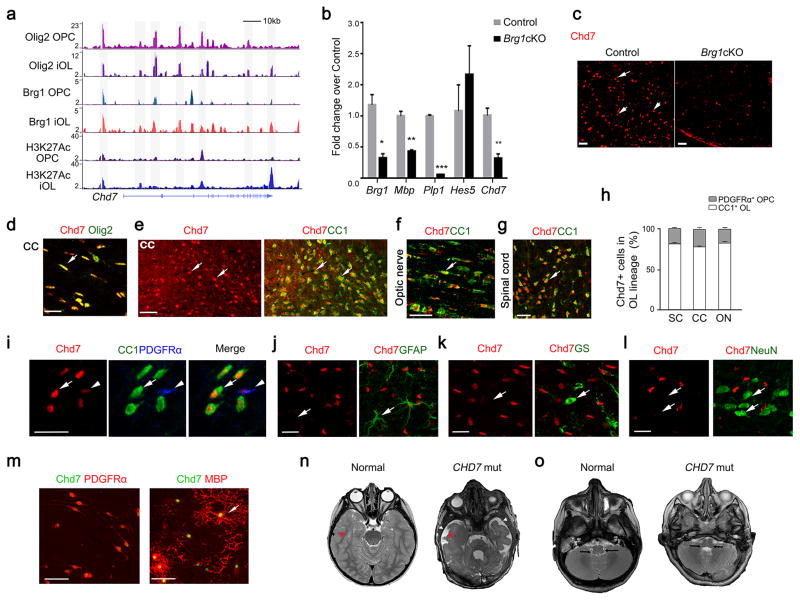
Figure 1. Identification of OL-enriched Chd7 as a direct target of the Brg1/Olig2 complex.
(a) Track view of ChIP-Seq density profile for Olig2, Brg1 and H3K27Ac centered at the Chd7 locus in OPCs and OLs.
(b) qRT-PCR analysis of myelination-associated genes and Chd7 in spinal cords from control (Ctrl) and Brg1cKO animals at P14 (The data are presented as mean ± s.e.m. n = 3; for Brg1, * p = 0.024, t = 3.52; for Mbp, ** p = 0.0018, t = 7.40; for Plp1, *** p < 0.0001, t = 40.94; for Hes5, p = 0.448, t = 1.72; for Chd7, ** p = 0.007, t = 5.02; n, numbers of animals; Two-tailed unpaired Student’s t test).
(c) Immunostaining showing Chd7 expression in spinal cords of control (Brg1flox/+;Olig1-Cre+/−) and Brg1cKO animals at P14. Arrows indicate Chd7+ cells. Scale bar, 50 μm.
(d) Co-immunolabeling of Chd7 and Olig2 on the corpus callosum (CC) of wildtype brain at P7. Scale bar, 20 μm.
(e) Co-immunolabeling of Chd7 and CC1 in the corpus callosum (CC) of P14 mice. Arrows indicate co-labeled cells. Scale bar, 50 μm.
(f,g) Immunolabeling of Chd7 and CC1 on longitudinal sections of optic nerves (f) and coronal sections of the spinal white matter (g) at P14. Arrows indicate co-labeled cells. Scale bars in (f), 25 μm; (g), 50 μm.
(h) The percentage of CC1 or PDGFRα+ cells among total Chd7+ cells in the cortex (Ctx), spinal cord (SC) and optic nerve (ON) from P14 wildtype mice (n = 3 animals).
(i) Immunostaining showing expression of CC1, PDGFRα and Chd7 in the cortical section of P14 mice. Arrows and arrowheads indicate CC1+Chd7hi OLs and PDGFRα+Chd7low OPCs, respectively. Scale bar, 30 μm.
(j–l) Immunostaining for Chd7 and GFAP (arrow in j) in the P24 cortex, glutamine synthetase (GS) (arrow in k) in the P7 cortex, and NeuN (arrow in l) in the P24 cortex. Arrow indicates GFAP+ astrocyte. Scale bars, 25 μm (j); 20 μm (k,l)
(m) Immunolabeling of Chd7 with PDGFRα in OPCs (left) or with MBP in OLs (right) in vitro. Scale bar, 50 μm.
(n,o) Representative T2-weighted magnetic resonance imaging (MRI) scans of cortices (n) and brainstem/cerebellar regions (o) in a normal and a 3-year old boy with CHARGE Syndrome carrying a CHD7 nonsense truncation mutation (7252C>T). In panel n, asterisks indicate the white matter, and arrowheads indicate CSF-filled fluid space. Arrows in o indicate white matter structures in the brainstem and cerebellum region that are dysmorphic in the patient.

