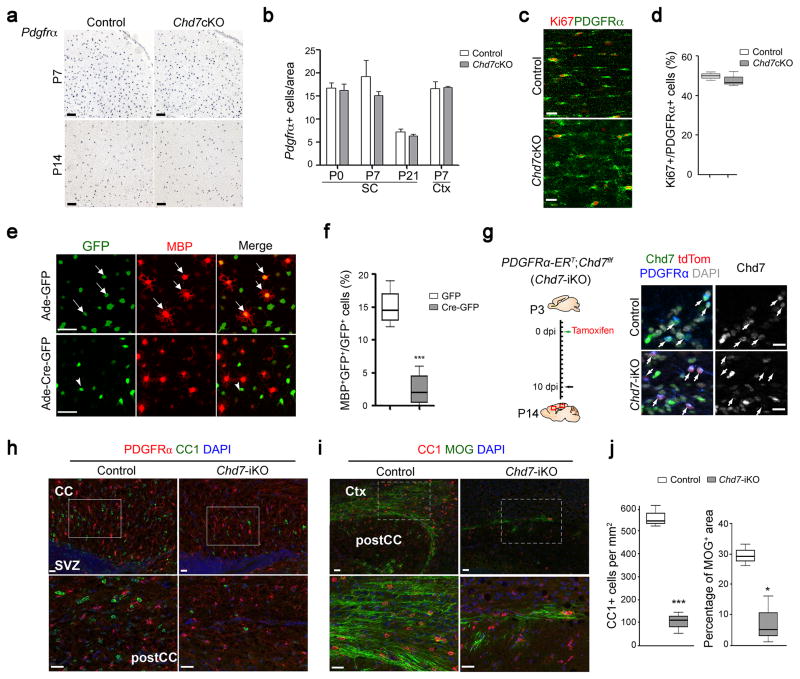
Figure 3. Chd7 deletion does not affect OPC development but impairs their differentiation in a cell-autonomous manner.
(a) In situ hybridization for Pdgfrα on forebrain sections of control and Chd7cKO mice at P7 and P14, as indicated. Scale bars, 100 μm.
(b) Quantification of the number of Pdgfrα+ cells per area (0.04 mm2) in the cortex (Ctx) and spinal cord (SC) of control and Chd7cKO (The data are presented as mean ± s.e.m. For P0 SC, n = 4 controls and 3 mutants, p = 0.741, t = 0.348; for P7 SC, n = 3 controls and 3 mutants, p = 0.417, t = 0.905; for P21 SC, n = 4 controls and 3 mutants, p = 0.434, t = 0.849; for P7 Ctx, n = 3 controls and 3 mutants, p = 0.873, t = 0.17; n, numbers of animals; Two-tailed unpaired Student’s t test).
(c) Immunostaining for Ki67 and PDGFRα in the corpus callosum from P7 control and Chd7cKO mice. Scale bar, 20 μm.
(d) Quantification of Ki67+ cells as a percentage of PDGFRα+ OPCs within the corpus callosum of P7 control and Chd7cKO mice (n = 3 control and 3 mutant animals, p = 0.709, t = 0.41; whiskers show minimum and maximum, box limits are first and third quartile and center lines are median; Two-tailed unpaired Student’s t test).
(e) Immunolabeling of MBP after 2 days of differentiation in Chd7f/f OPCs transduced with control GFP or Cre-GFP expressing adenoviruses. Arrows and arrowheads indicate the GFP or Cre-GFP virus transduced cells, respectively. Scale bar, 50 μm.
(f) Quantification of MBP+ OLs as a percentage of total GFP+ cells after 2 days of differentiation (n = 4 independent experiments, *** p < 0.001, t = 5.937; whiskers show minimum and maximum, box limits are first and third quartile and center lines are median; Two-tailed unpaired Student’s t test).
(g) Left: Diagram showing tamoxifen (TAM) administration to Chd7-iKO mice from P3 to P10 followed by tissue collection at P14. Right: Immunolabeling for Chd7, PDGFRα and tdTomato on the corpus callosum of wildtype and Chd7-iKO:Rosa26Tom mice. Nuclei are counterstained with DAPI. Scale bar, 20 μm.
(h,i) Immunolabeling for CC1 and PDGFRα (h) or MOG (i) on sagittal corpus callosum (CC) sections of TAM-treated control and Chd7-iKO mice at P14. Ctx, Cortex; SVZ, subventricular zone. Scale bars, 20 μm. Boxed areas in upper panels were shown at a high magnification in corresponding lower panels.
(j) Quantification of CC1+ OL density (left) and percentage of MOG+ area (right) in the corpus callosum of TAM-treated control and Chd7-iKO mice at P14 (n = 3 controls and 3 Chd7iKO animals; for CC1, *** p < 0.0001, t = 32.609; for MOG, * p = 0.0123, t = 4.331; whiskers show minimum and maximum, box limits are first and third quartile and center lines are median; Two-tailed unpaired Student’s t test).

