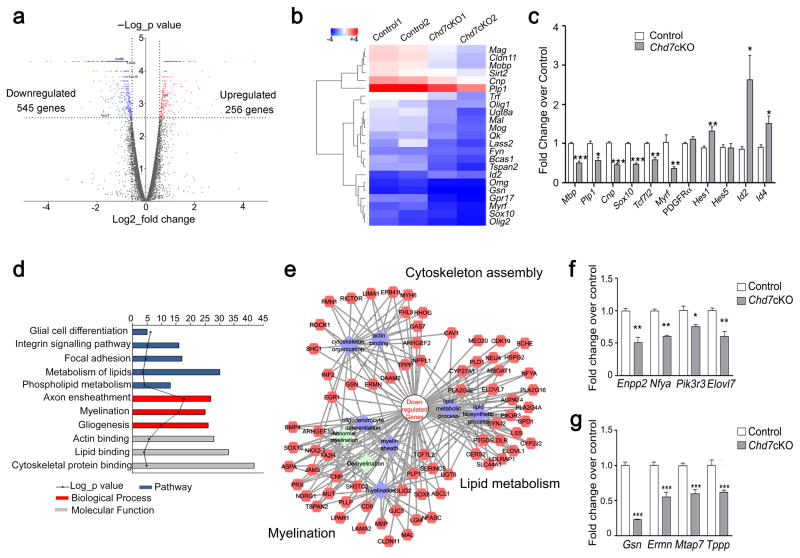
Figure 5. Chd7 controls the core myelinogenic regulatory network.
(a) Volcano plots depict gene expression changes between control and Chd7cKO spinal cord at P8. Significantly differential transcripts were highlighted in color and totaled in each direction (FDR < 0.05).
(b) Heat map representing the expression of OL differentiation-related genes in control and Chd7cKO spinal cords from two independent animals.
(c) qRT-PCR analysis of myelination-associated genes in P8 control and Chd7cKO spinal cords (The data are presented as mean ± s.e.m. n = 3 controls and 3 mutant tissues; for Mbp, *** p = 0.0008, t = 9.11; for Plp1 * p = 0.028, t = 3.37; for Cnp, *** p = 0.0001, t = 14.63; for Sox10, *** p = 0.0005, t = 10.05; for Tcf7l2, ** p = 0.0049, t = 5.62; for Myrf, * p = 0.03, t = 3.29; for Pdgfrα, p = 0.168, t = 1.68; for Hes1, * p = 0.027, t = 3.38; for Hes5, p = 0.98, t = 0.02; for Id2, * p = 0.049, t = 2.81; for Id4, * p = 0.03, t = 3.29; Two-tailed unpaired Student’s t test).
(d) The gene ontology (GO) analysis of the significantly down-regulated genes between control and Chd7cKO.
(e) Protein-protein interaction networks among down-regulated genes in Chd7cKO are plotted using a ToppGene suite.
(f,g) qRT-PCR validation of selected genes involved in lipid metabolism (f) and cytoskeleton organization in control vs. Chd7cKO spinal cords at P8 (g) (The data are presented as mean ± s.e.m. n = 3 controls and 3 mutant tissues; for Enpp2, ** p = 0.002, t = 6.67; for Nfya, ** p = 0.0018, t = 7.41, for Pik3r3, * p = 0.046, t = 2.86; for Elovl7, ** p = 0.0012, t = 8.22; for Gsn, *** p < 0.001, t = 14.809; for Ermn, *** p < 0.001, t = 8.659; for Mtap7, *** p < 0.001, t = 10.181; for Tppp, *** p < 0.001, t = 9.907; Two-tailed unpaired Student’s t test).

