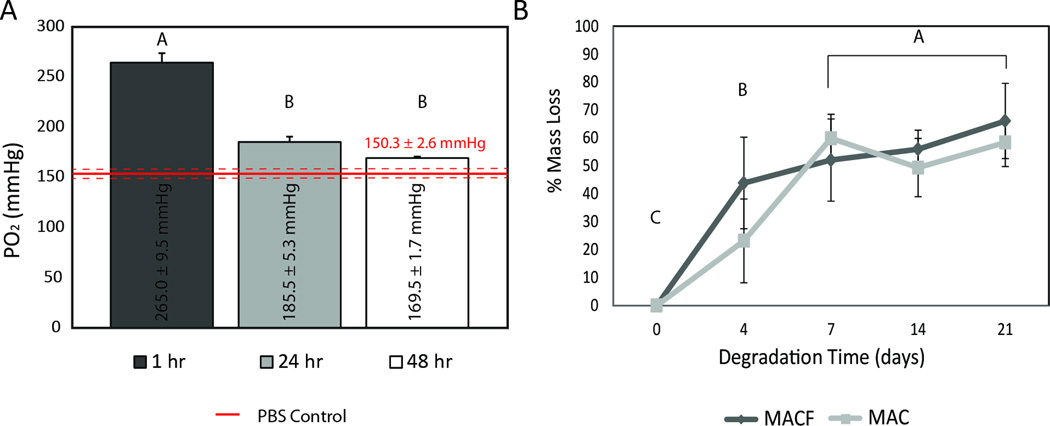
Figure 2.
A) Oxygen release from MACF + O2 hydrogels in a static well-plate maintained at atmosphere and 37°C. Different letters denote statistical significance by one factor ANOVA (p < 0.0001) Mean ± SD, n = 3. B) Degradation testing of MAC and MACF hydrogels in PBS + 1000 U/mL lysozyme maintained at 37°C. Different letters denote statistical significance by one ANOVA with student’s t test (p < 0.0001). Mean ± SD, n = 4.

