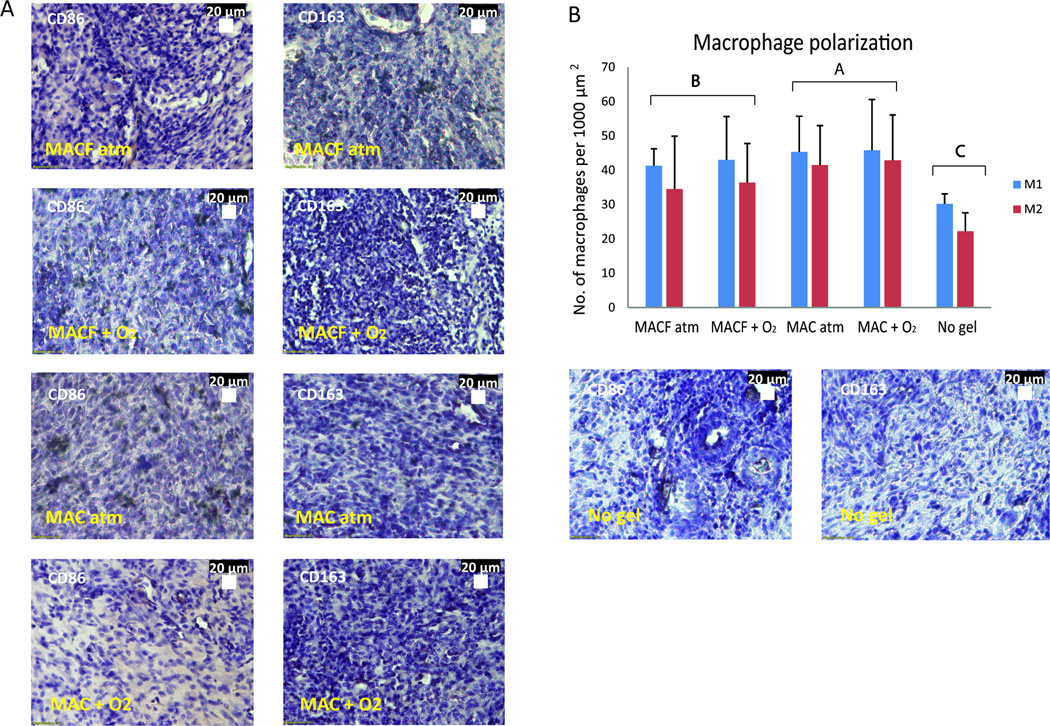
Figure 7.
A) Representative images of CD86 (M1 inflammatory macrophage) immunostaining on wound sections (left) and CD163 (M2 anti-inflammatory macrophage) immunostaining (right). Positive staining is brown in color, purple are nuclei via hematoxylin. B) Number of macrophages per 1000 µm2 area for M1 and M2 macrophages inside the wound area of sections. Different letters denote statistical significance by two factor ANOVA (p < 0.0001) using Tukey’s post hoc analysis. Mean ± SD, n = 3.

