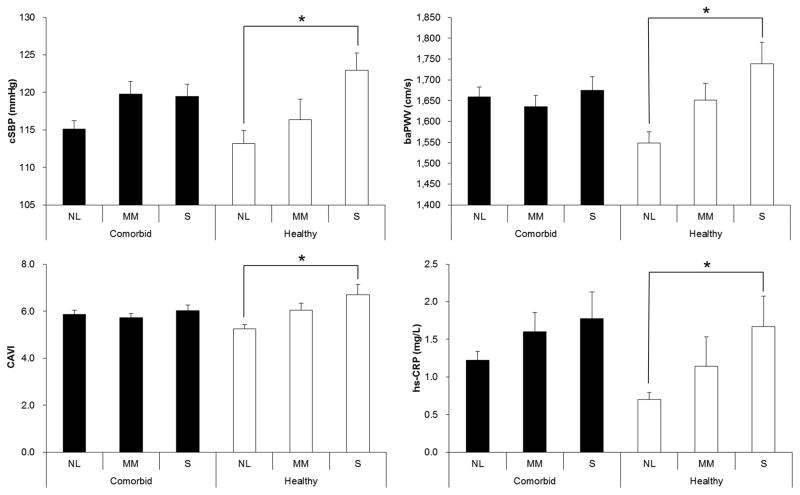
Figure 1.
The normal AHI and severe OSA subgroups of the healthy group showed differences in cSBP, baPWV, CAVI and hs-CRP. Black and white bars indicate the mean of comorbidity and healthy groups, respectively, and the error bars show SEM. *P<0.05, post hoc test by Bonferroni method following ANOVA. NL, normal group; MM, mild-to-moderate OSA group; S, severe OSA group; cSBP, central systolic blood pressure; baPWV, brachial-ankle pulse wave velocity; CAVI, cardio-ankle vascular index; hs-CRP, high sensitivity C-reactive protein; AHI, apnea-hypopnea index; OSA, obstructive sleep apnea; SEM, standard error of means

